Find it. Check it. Keep watching.
degench.art is a live DEX chart and publishing tool. Its main job is to shorten the path from finding an active pair to understanding what is happening now. It does not predict returns or decide whether you should trade.
- 1. Decide sooner
- Find active pairs, inspect executed swaps, and check price, volume and liquidity in one view.
- 2. Miss less
- Keep a chart visible, save pairs, and receive selected alerts away from the tab.
- 3. Show the work
- Export the chart or publish a timestamped post that others can inspect later.
- 4. Enjoy the process
- Change the presentation, react to live events, and make chart posts look like your own.
Profit is an outcome, not a product feature. The useful promise here is narrower: less time switching between charts, transaction pages and social feeds, with observed facts kept separate from interpretation.
contents
01find active pairs
Start with the exact market.
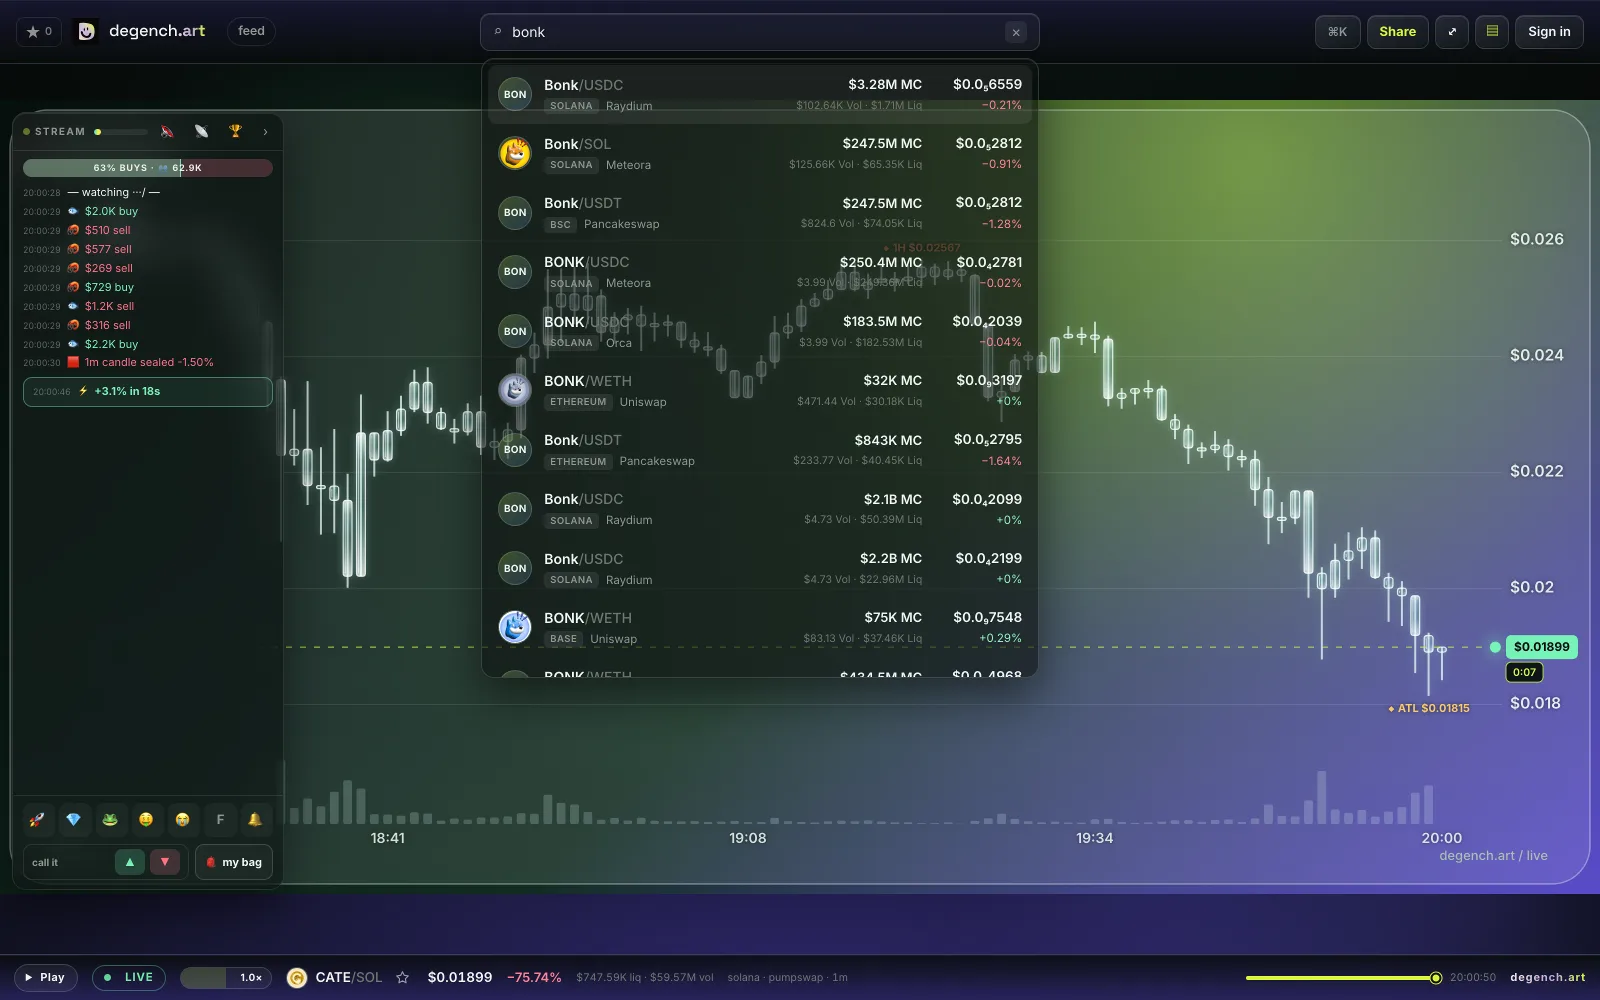
Paste a contract address, search by symbol, or open a pair link. Search results show the chain, market cap and one-hour move so similarly named tokens can be separated before opening the chart.
The empty watchlist shows current movers. Teleport, opened with the swirl button or N, chooses another pair from that discovery set and excludes the pair already open. Organic movers receive three times the selection weight of paid DexScreener boosts. A paid result is labelled boosted in search, the strip and the arrival message.
- Use an address when possible
- A ticker is not unique. Confirm the chain, token address and pool before acting.
- Trending is attention
- A fast move or paid boost is not evidence that price will continue in the same direction.
02read swaps, flow and liquidity
Read what has traded, not what someone claims.
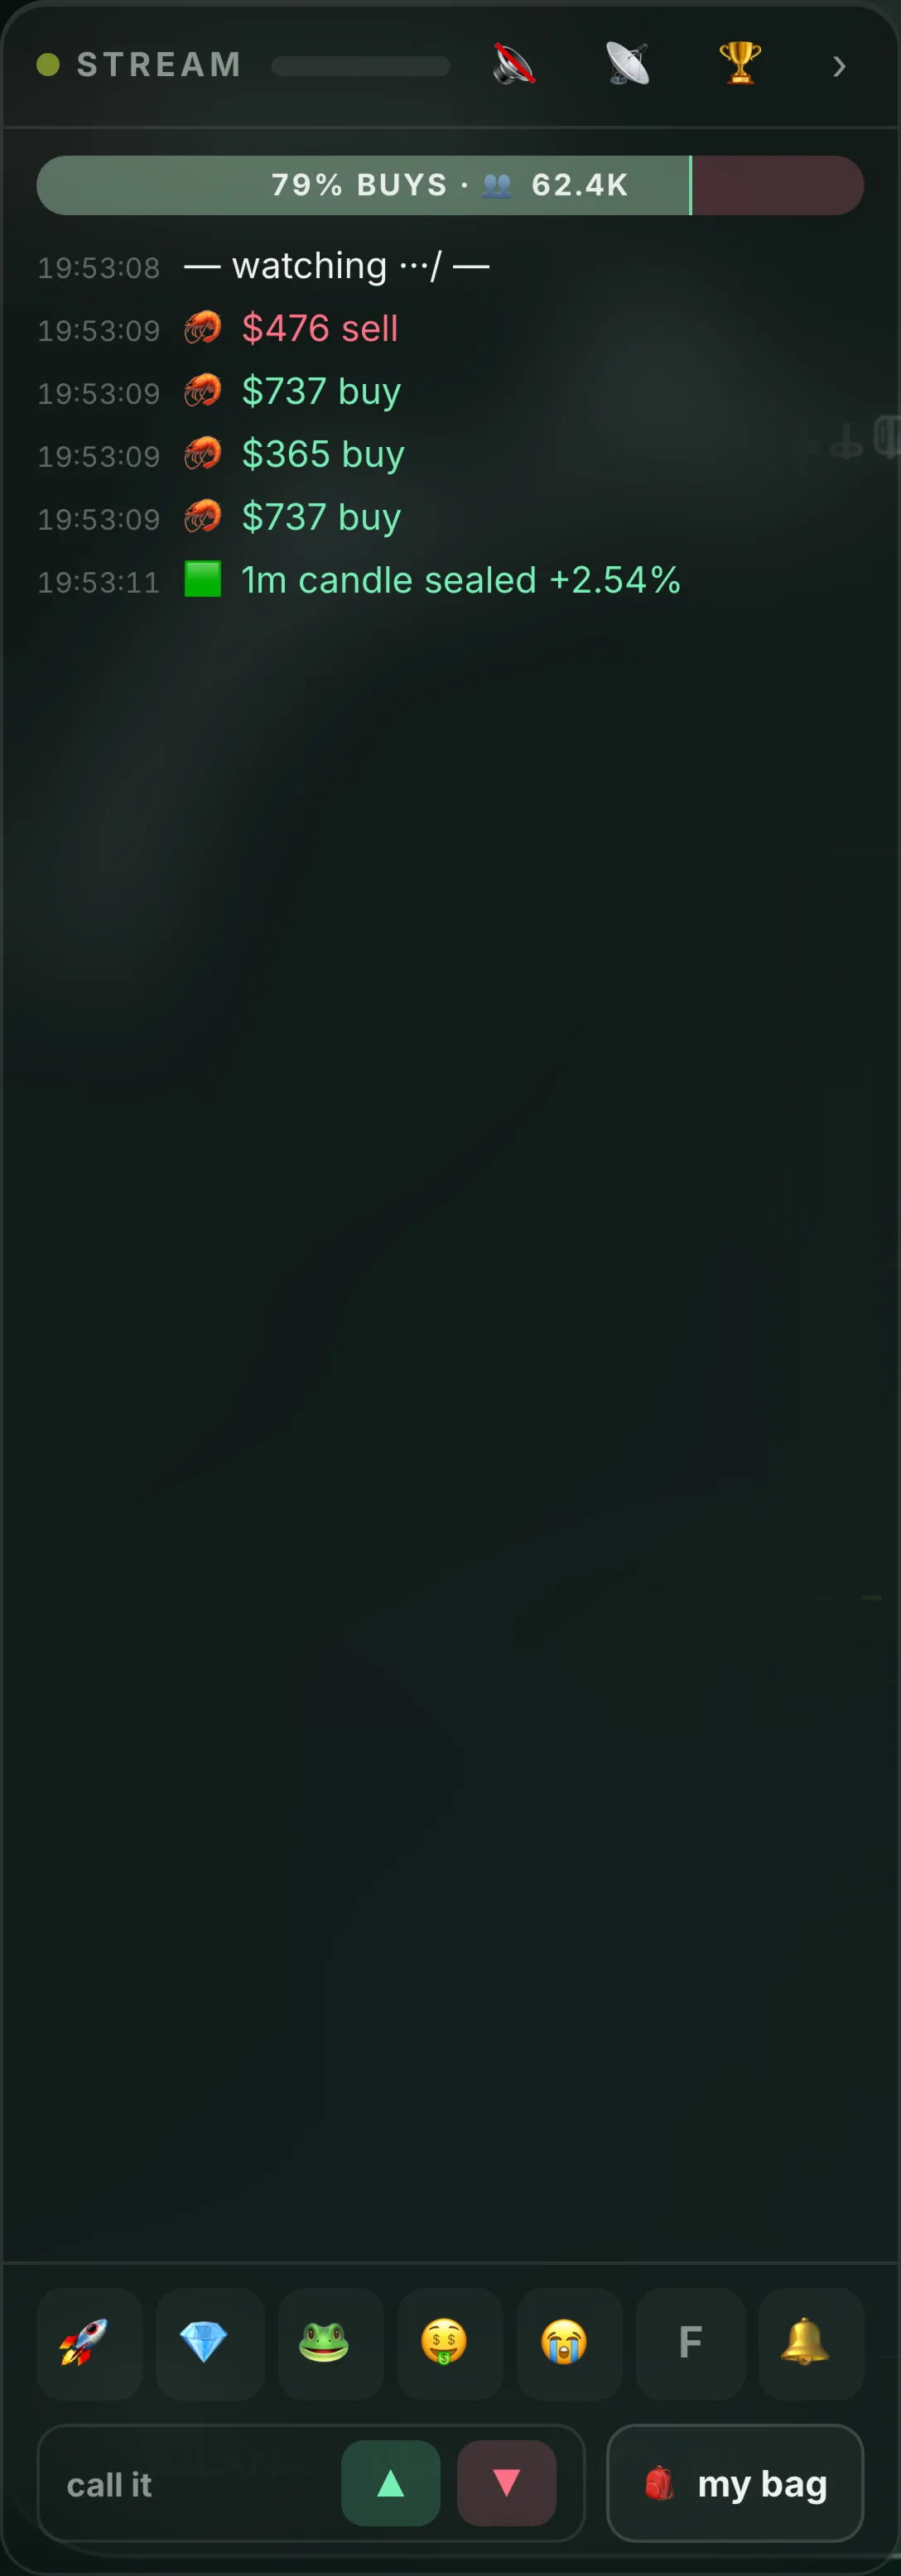
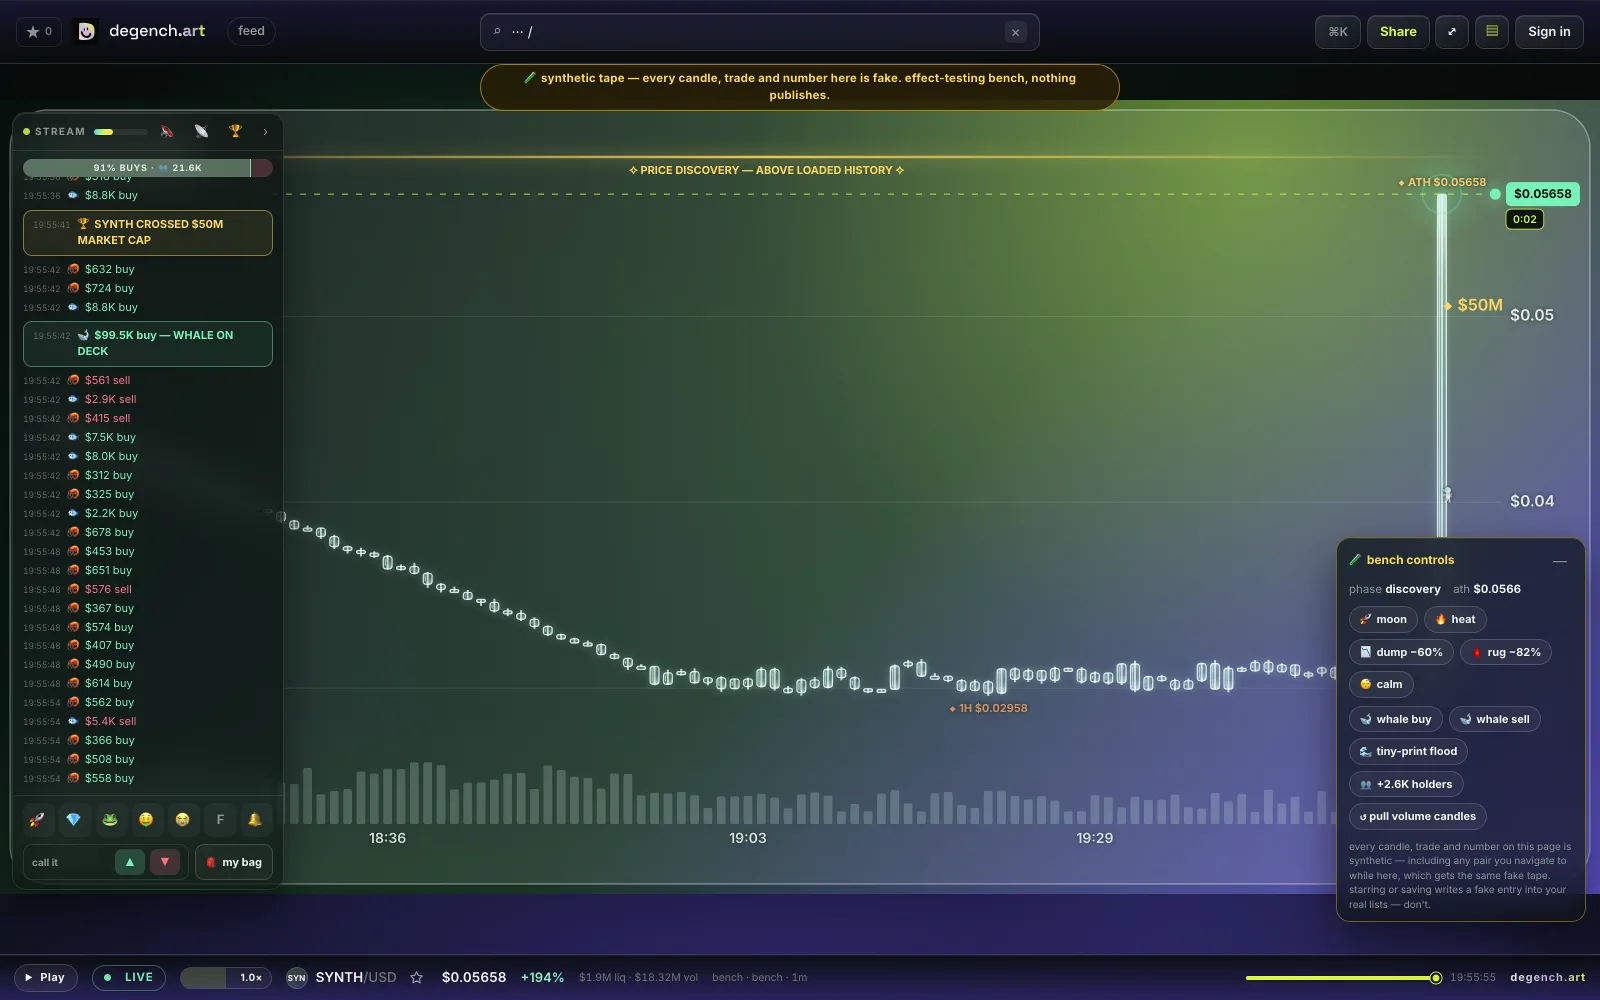
The stream rail summarizes executed pool swaps. It shows buys and sells, dollar totals for the current visit, and size tiers from shrimp to whale. The whale threshold is adjustable. Because AMMs do not expose a conventional resting order book, the rail does not pretend to show one.
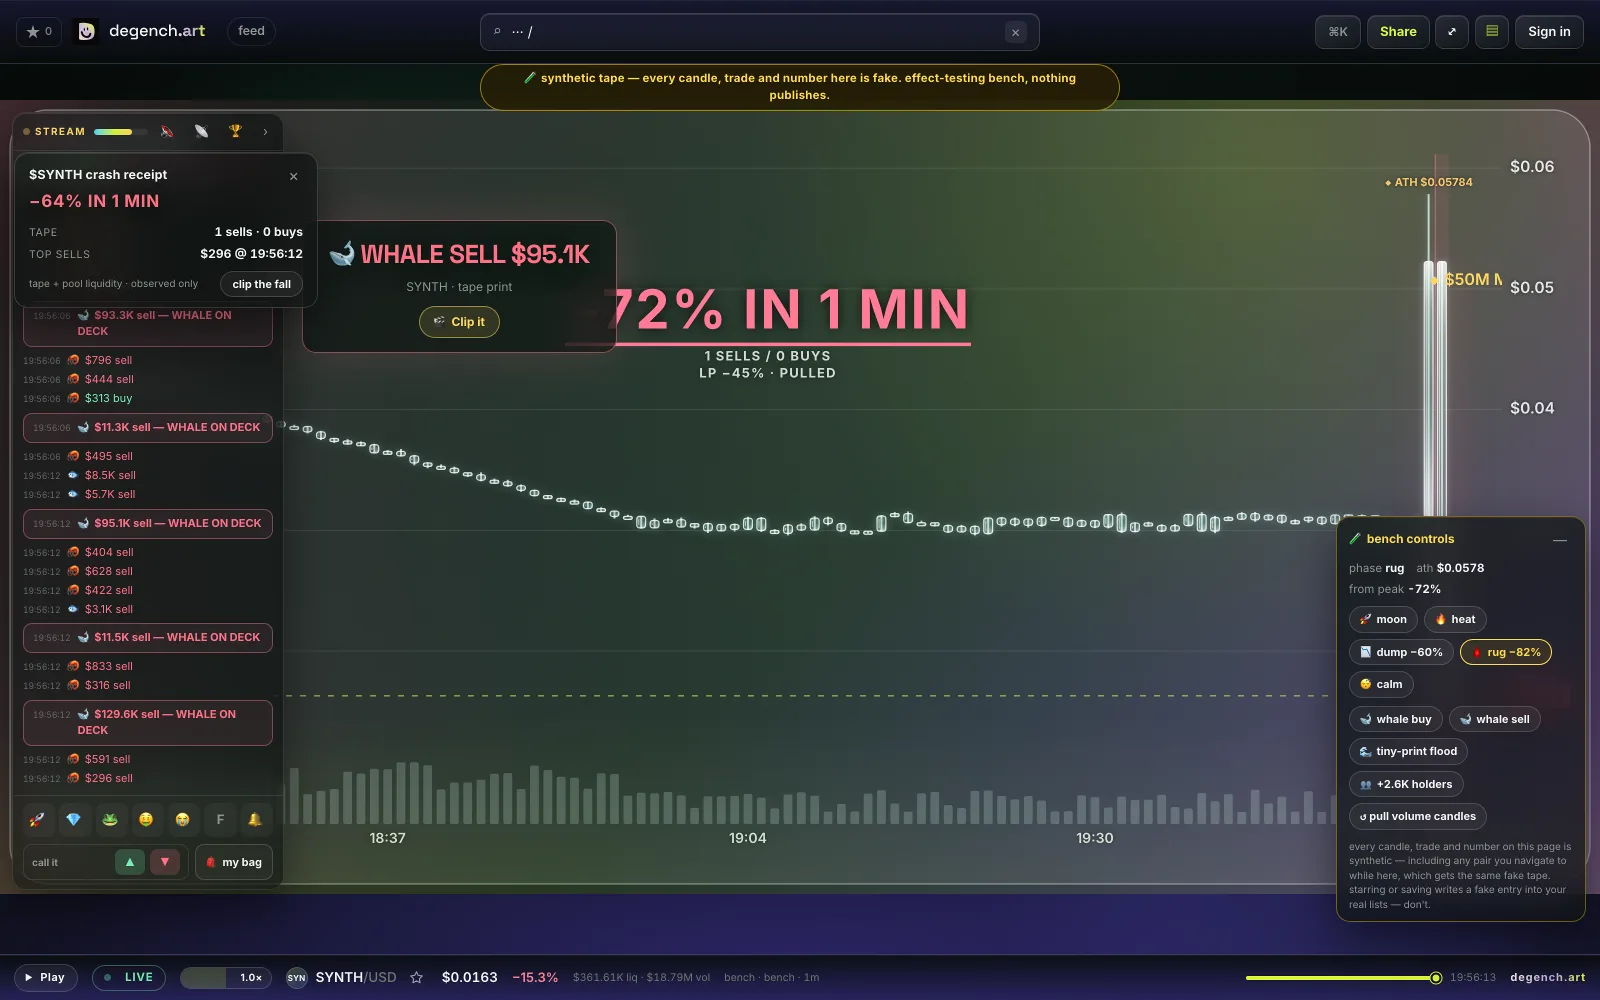
Large swaps get a follow-up after 60 seconds when the price move is material. The result states whether a buy held or faded, or whether a sell landed or was absorbed. After a severe drawdown, the crash receipt summarizes depth, speed, large sellers and the observed change in pool liquidity.
- Swap-flow signals
- Print-rate acceleration over two minutes, five-minute buy or sell dollar share, price-versus-flow divergence, and a 15-minute liquidity change.
- Candle-close signals
- RSI-14 recrosses, Bollinger 20/2σ re-entry or squeeze breaks, MA20/50 crosses, window-VWAP reclaim or loss, volume versus the 30-bar median, and proximity to a fib drawn by the user.
- Event markers
- Whale swaps, signal firings and market events can be pinned to the bar on which they occurred. Alert-grade events can be sent directly to Clip mode.
These are deterministic observations from the loaded candles, swaps and liquidity samples. They do not identify wallet intent, guarantee execution, or predict the next move. A trader can also split one order across many swaps.
03check the setup
Use the chart to confirm or reject the idea.
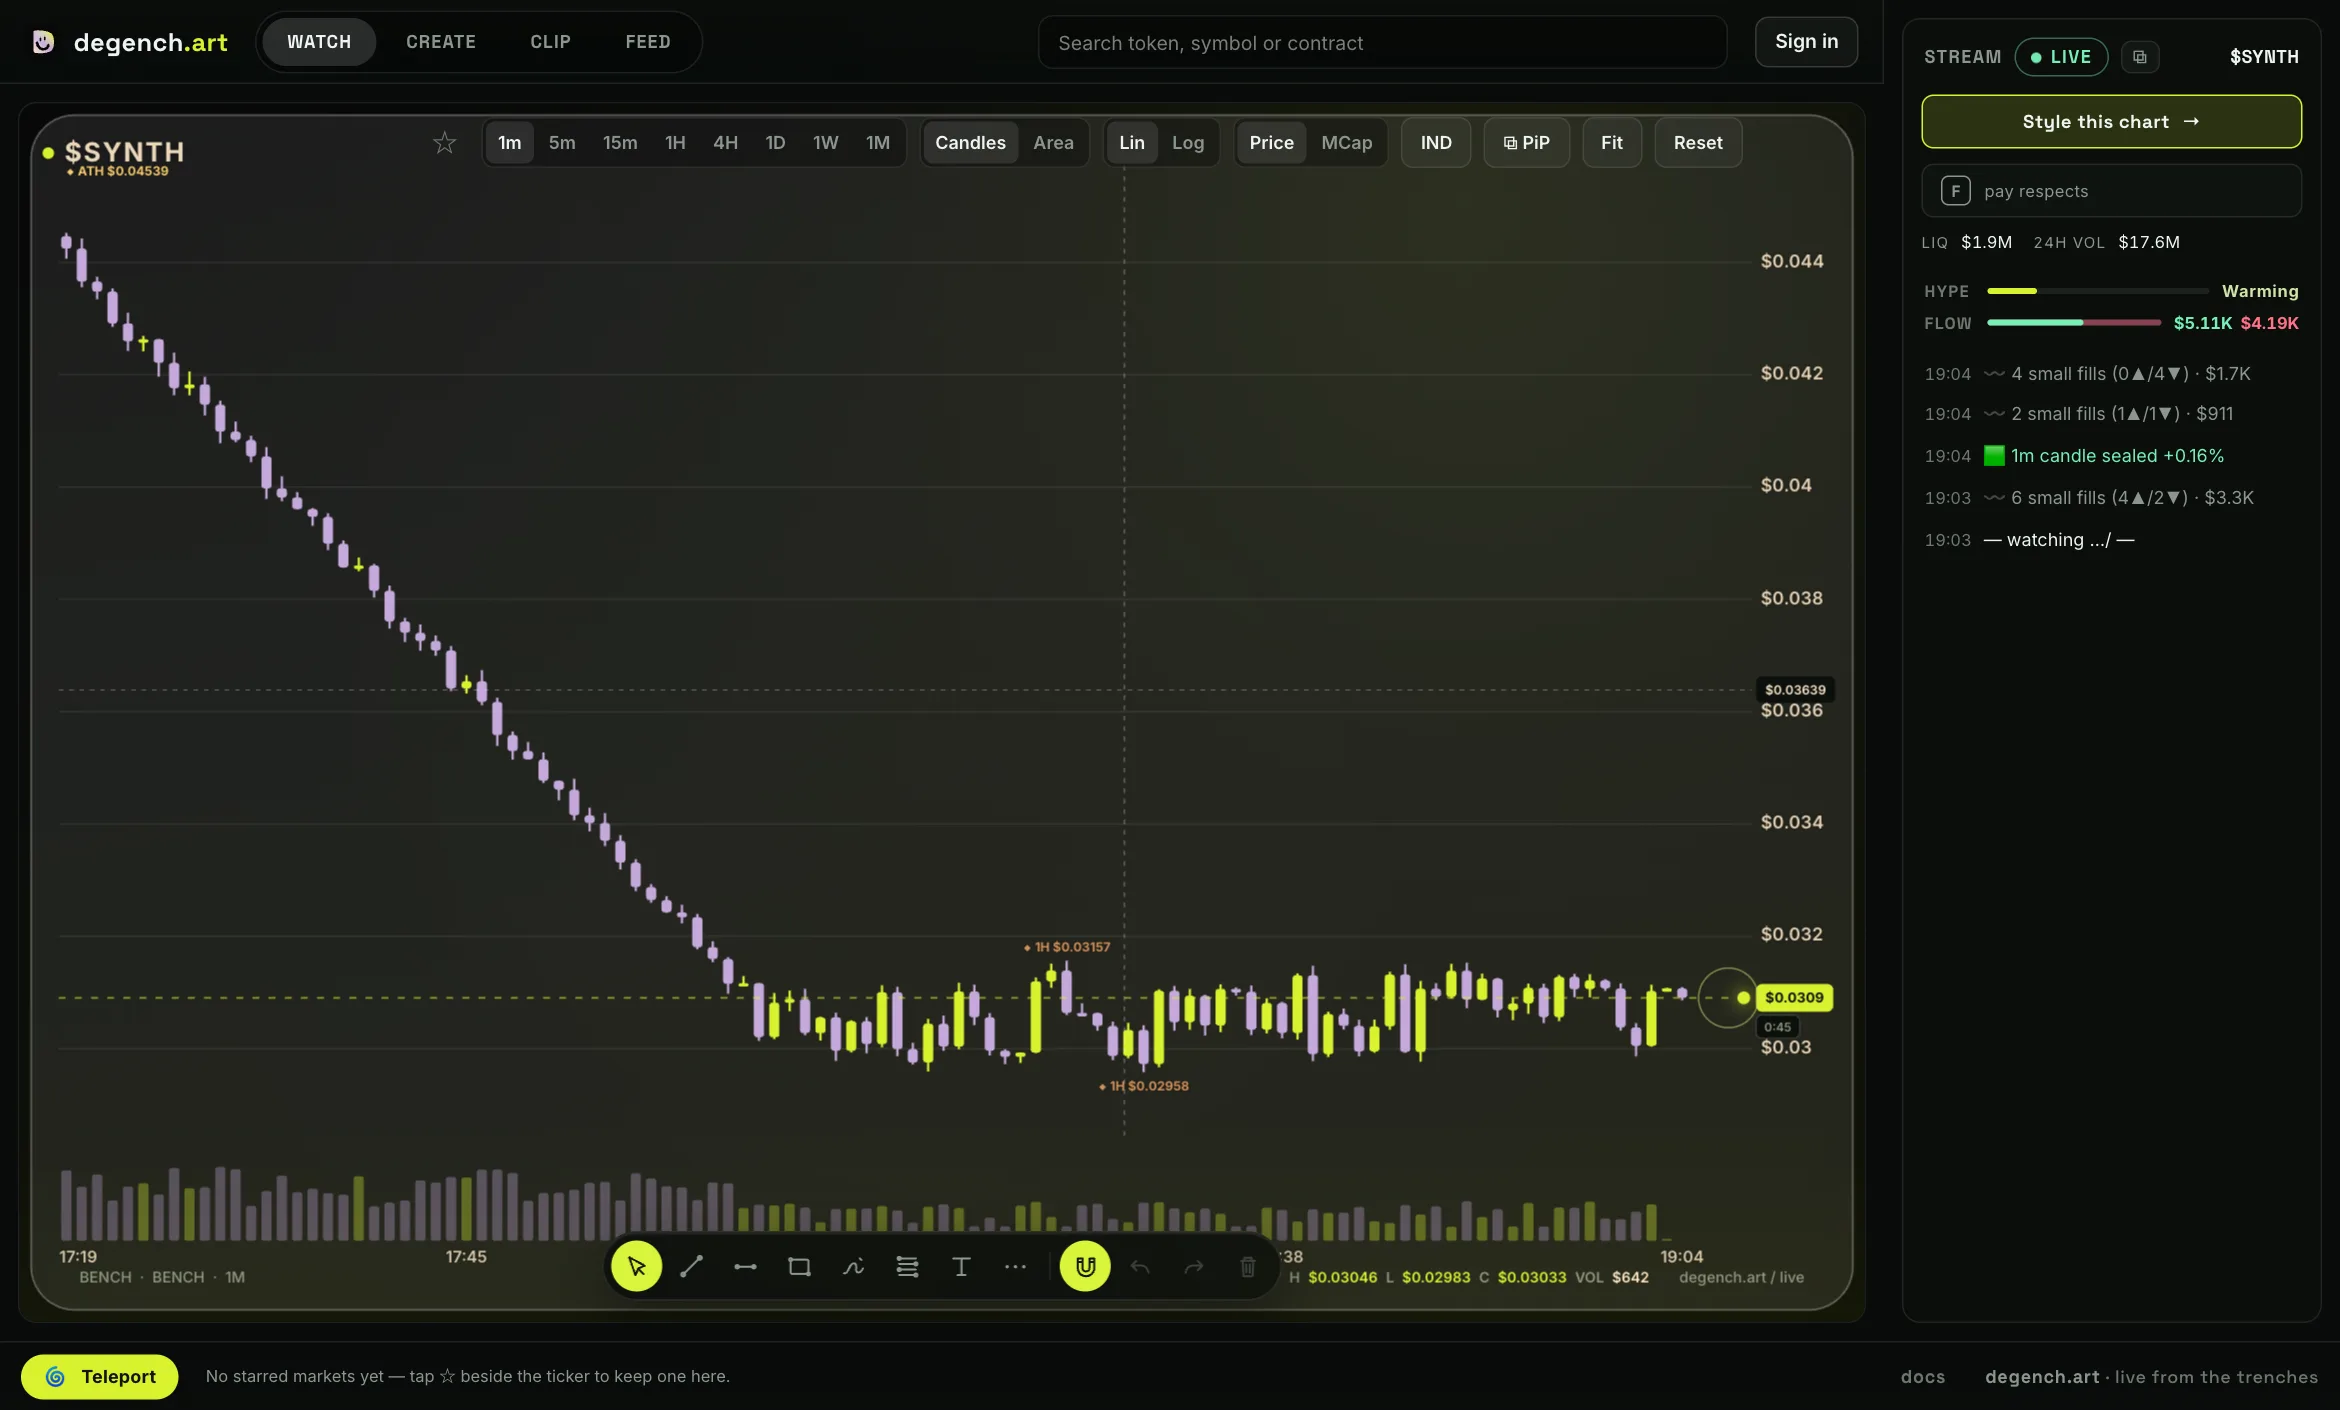
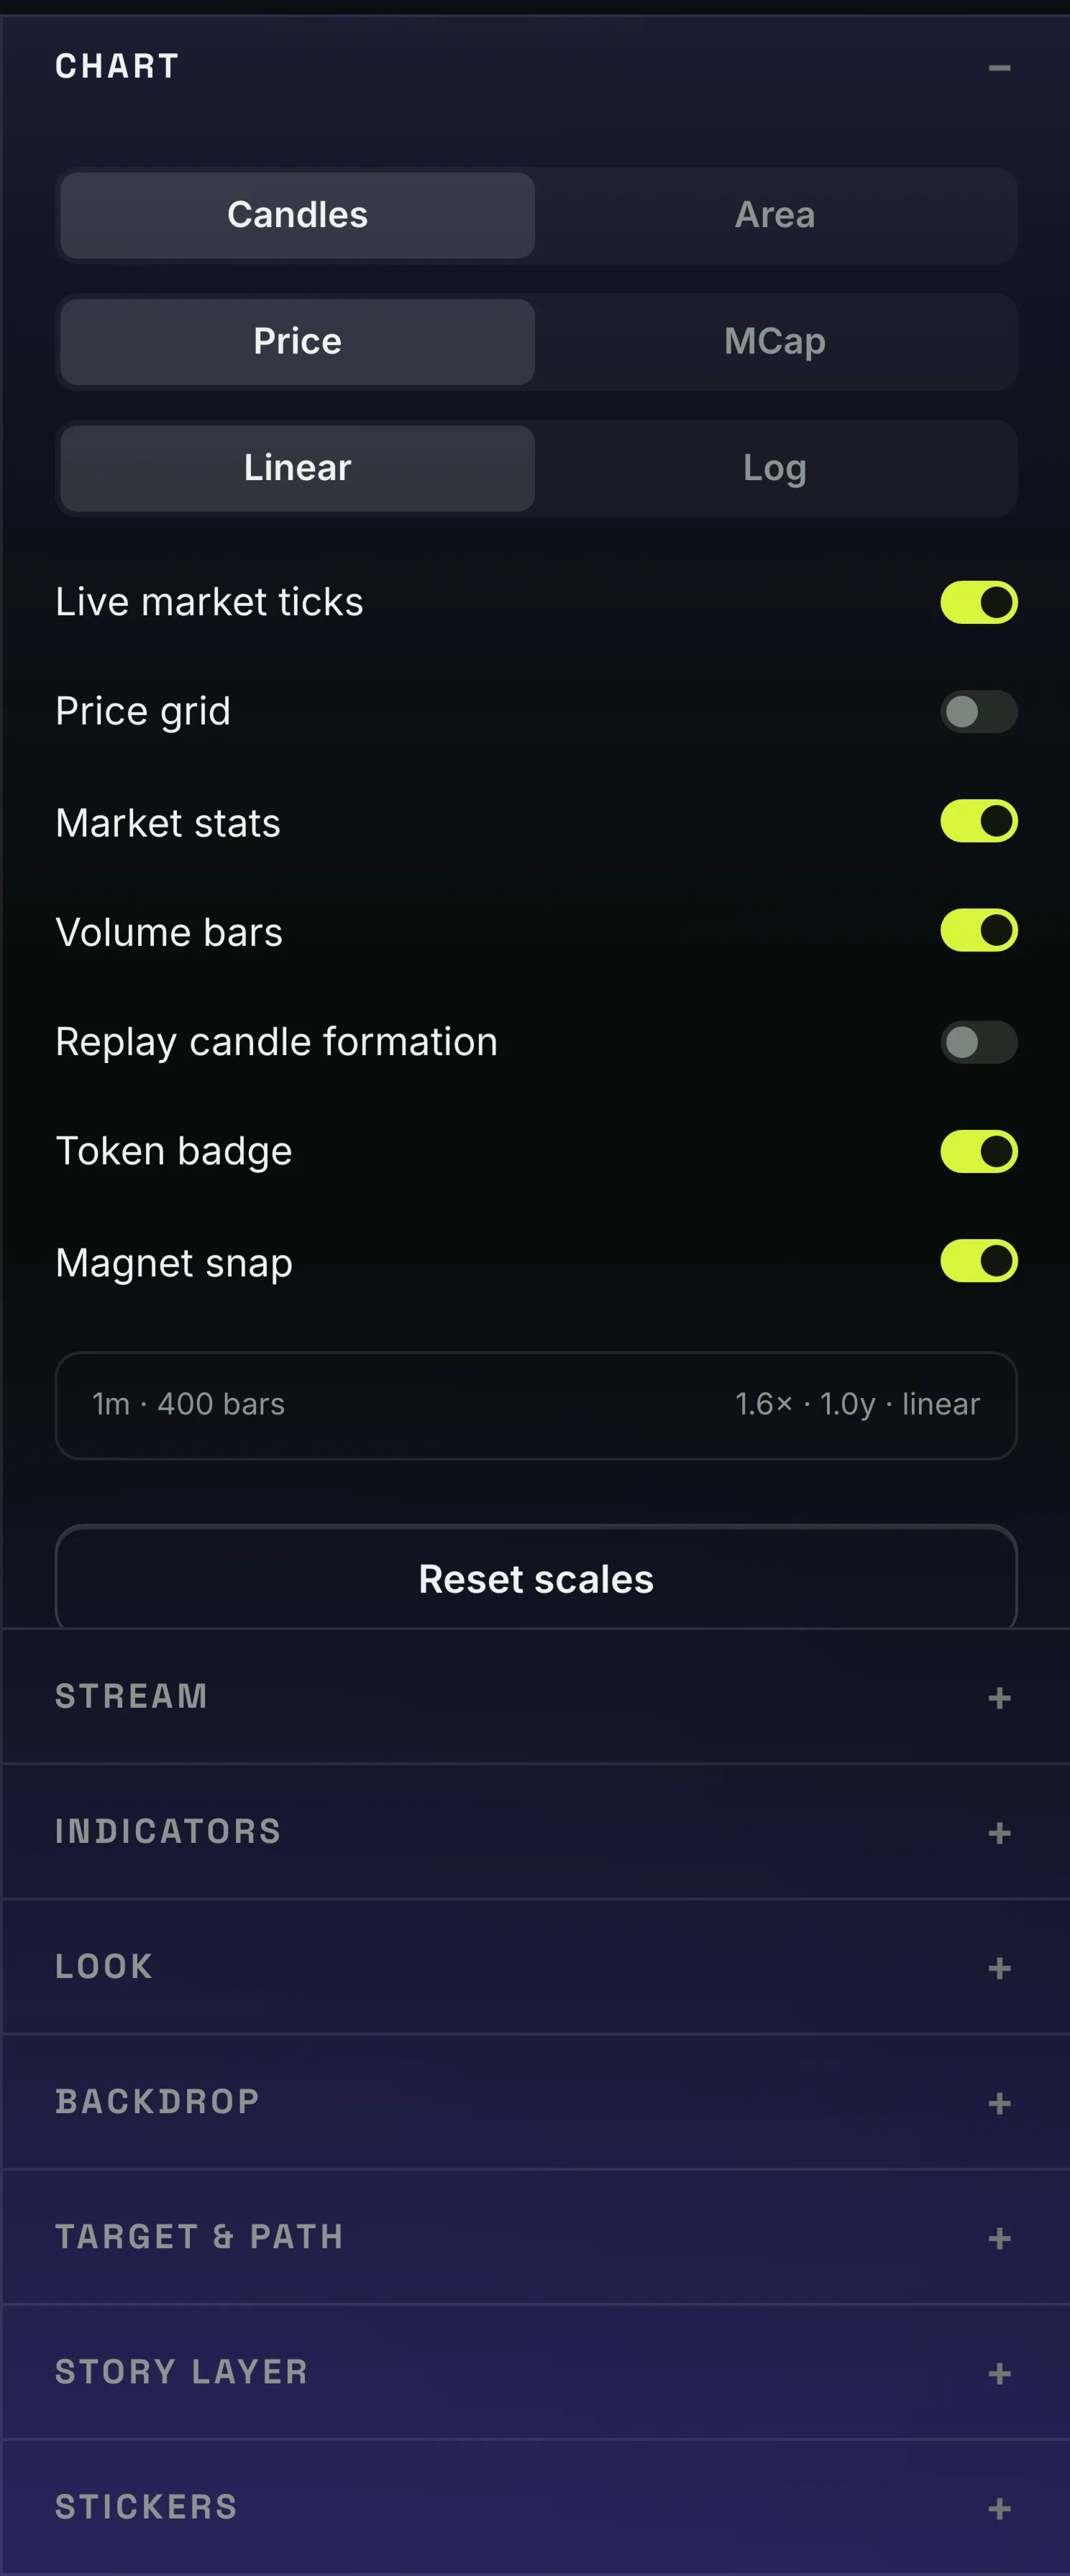
Each URL identifies one chain and pool. The chart supports candles or area, price or market-cap scale, linear or log scale, volume bars and standard drawing tools. Drawings are saved per pool in the browser and export in the same position in which they were drawn.
- Chains
- Solana, Base, BSC, Ethereum and Robinhood.
- Timeframes
- 1m, 5m, 15m, 1H, 4H, 1D, 1W and 1M. Resampled candles are labelled when the source does not provide that interval directly.
- Indicators
- MA20/50/200, EMA9/21, window VWAP, Bollinger Bands, volume profile, order blocks, RSI-14, MACD 12/26/9, stochastic 14/3/3 and ATR-14.
- Drawings
- Trend and horizontal lines, rays, rectangles, brush, fib tools, channels, measure, arrows and text, with optional magnet snap.
Volume profile is traded volume by price, not resting demand. Order blocks are defined here as the last opposite candle before a qualifying impulse. Window VWAP starts at the first loaded candle. These definitions matter when comparing the output with another charting platform.
04keep the market visible
Watch the pair without staying on one tab.
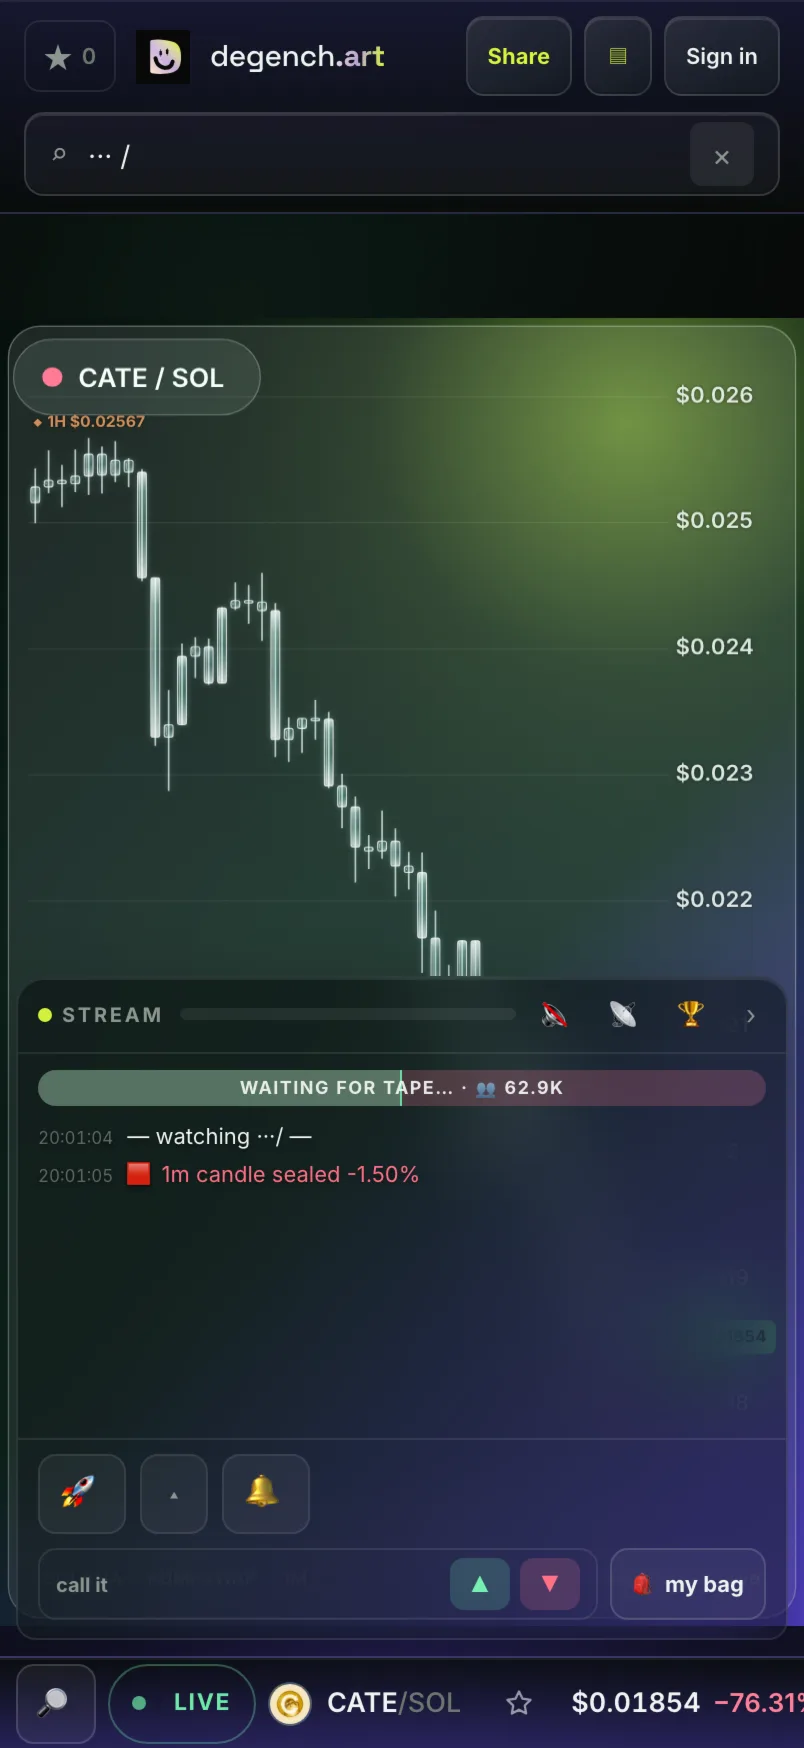
Starred pairs form a watchlist with market cap and 24-hour change, and the list can be sorted by price. The strip refreshes about once a minute. One-shot price alerts and selected live events appear in the app. Browser push and Telegram delivery depend on the deployment configuration and are off until the user enables them.
Picture in Picture opens the live chart in a floating window when the browser supports native PiP. If it does not, degench.art pins the chart inside the current tab. On iPhone, Safari may be required instead of the installed home-screen app. Closing the source tab ends the stream.
- Telegram
/creturns a still chart,/gifreturns a moving chart, and/styleapplies a saved style code.- Discord not enabled
- Uses the same renderer so charts created in chat match charts created in the app.
05save and share the evidence
Export the chart instead of photographing the screen.
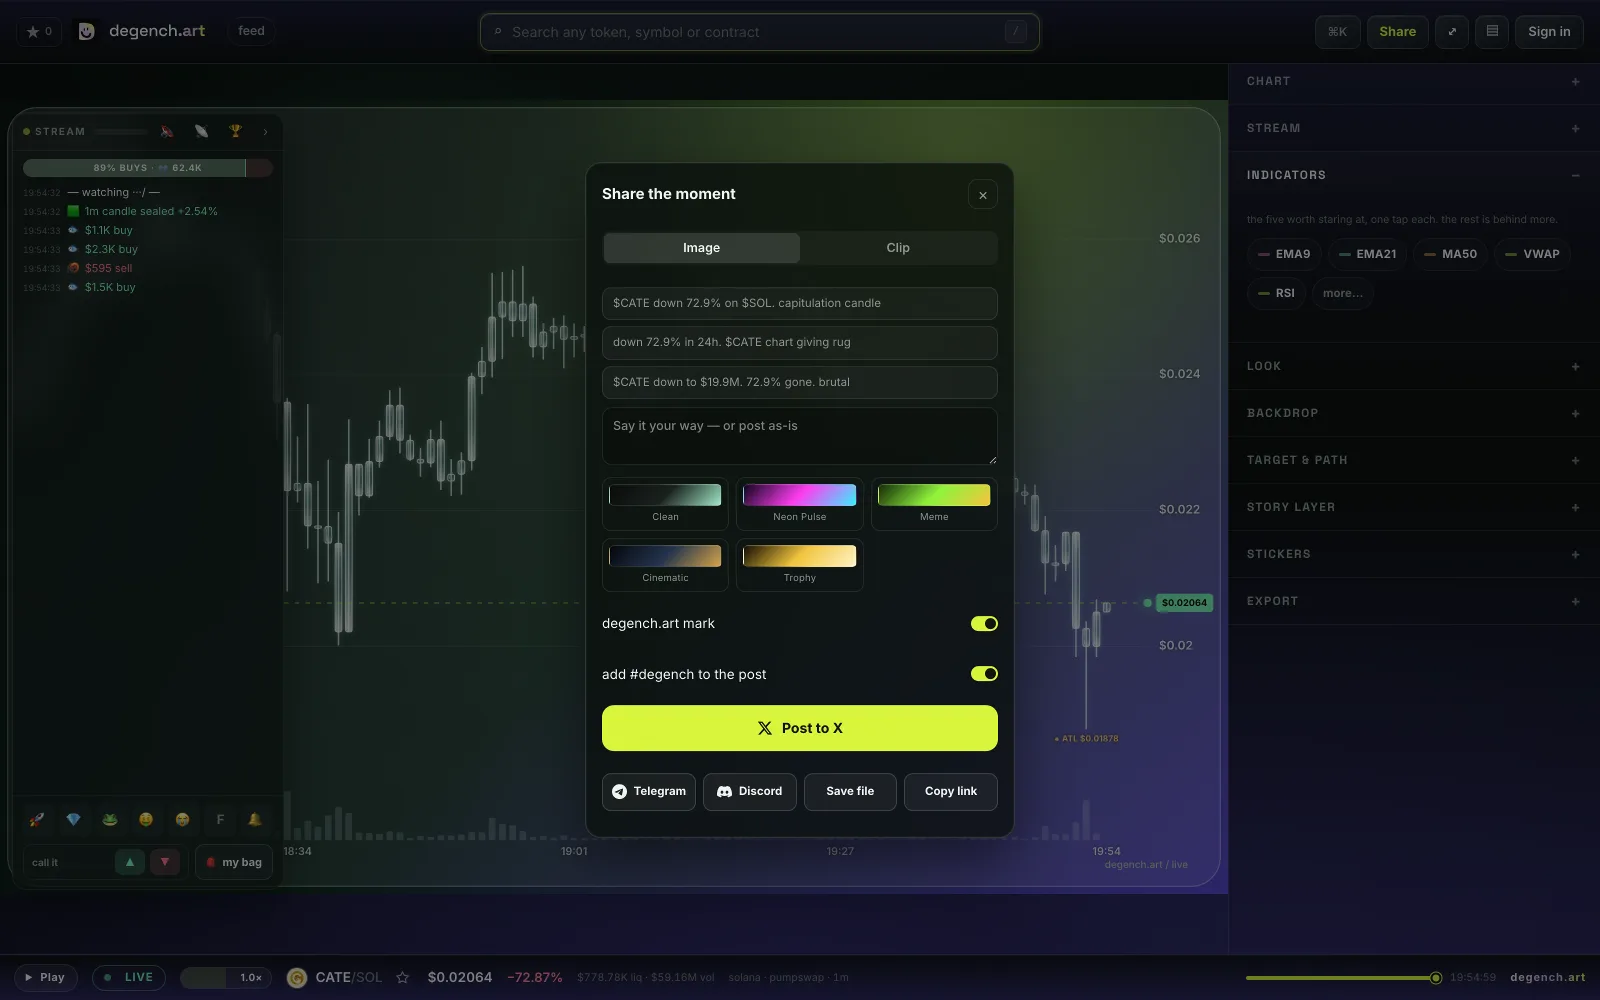
Clip mode renders from the same chart renderer used on screen. It exports PNG stills and MP4, WebM or GIF loops. The selected moment, drawings, theme and caption are part of the file.
On a compatible phone, the native share sheet receives the actual file. On desktop, a staged share card provides the preview used by X and links back to the exact pair. The contract address is included by default and can be removed before posting.
An exported file shows what the user rendered. A post published to the degench.art feed also records server time and pair metadata. Neither proves that the author traded at the price shown.
Put a live chart on your own site.
Copy embed, beside the share buttons, returns an iframe that renders this pair in the theme currently on the stage. It is a live chart, not a screenshot: it polls on its own and needs no script tag.
The URL is meant to be edited by hand: /embed/{chain}/{pool}?skin={theme}&tf={timeframe}.skin takes any theme id from Create — vaporwave, matrix-green, reverse — and tf takes any timeframe the app offers, such as 15m or 1h. An unrecognised value falls back to the house look rather than failing, so an embed left on a page keeps drawing a chart after a theme is renamed.
The look travels entirely in that URL. Nothing is read from the visitor's saved settings, so the chart is the same for everyone who loads the page, and an embedded chart never enters a visitor's recent markets.
06build a public track record
Build reputation from dated calls, not a bio.
When accounts and the feed are enabled, sign in with X or a Solana wallet. No email or password is required. A finished chart or clip can be published to the feed, where readers can sort recent, trending and followed accounts and react with a fixed emoji set. The feed has no comments.
The caught it badge is awarded when the token reaches 1.5 times the price recorded at publication within seven days. Misses remain private. Chart-day and clip-day streaks measure activity, not accuracy.
Caught it records one after-publication price outcome. It does not know the author's entry, size, exit, realized P&L or risk. Treat it as a public receipt for timing, not a complete performance record.
07customize the experience
Change the presentation without changing the data.
A theme changes the palette, candle material, background, motion and headline style. Individual colours, grid, backdrop and brand marks remain adjustable. Source logo and background files are read in the browser.
Market-cap and holder milestones, ATH breaks, volatility, drawdowns, large swaps and recovery steps can trigger visual or sound reactions. These events are derived from observed market data. Each reaction can be disabled.
Call the candle is a local prediction game for short timeframes. Its streaks and ranks are cosmetic. Caption generation uses token metadata and current values, with a deterministic fallback when the optional model is unavailable. User-drawn target paths are always stamped SCENARIO · NOT A FORECAST.
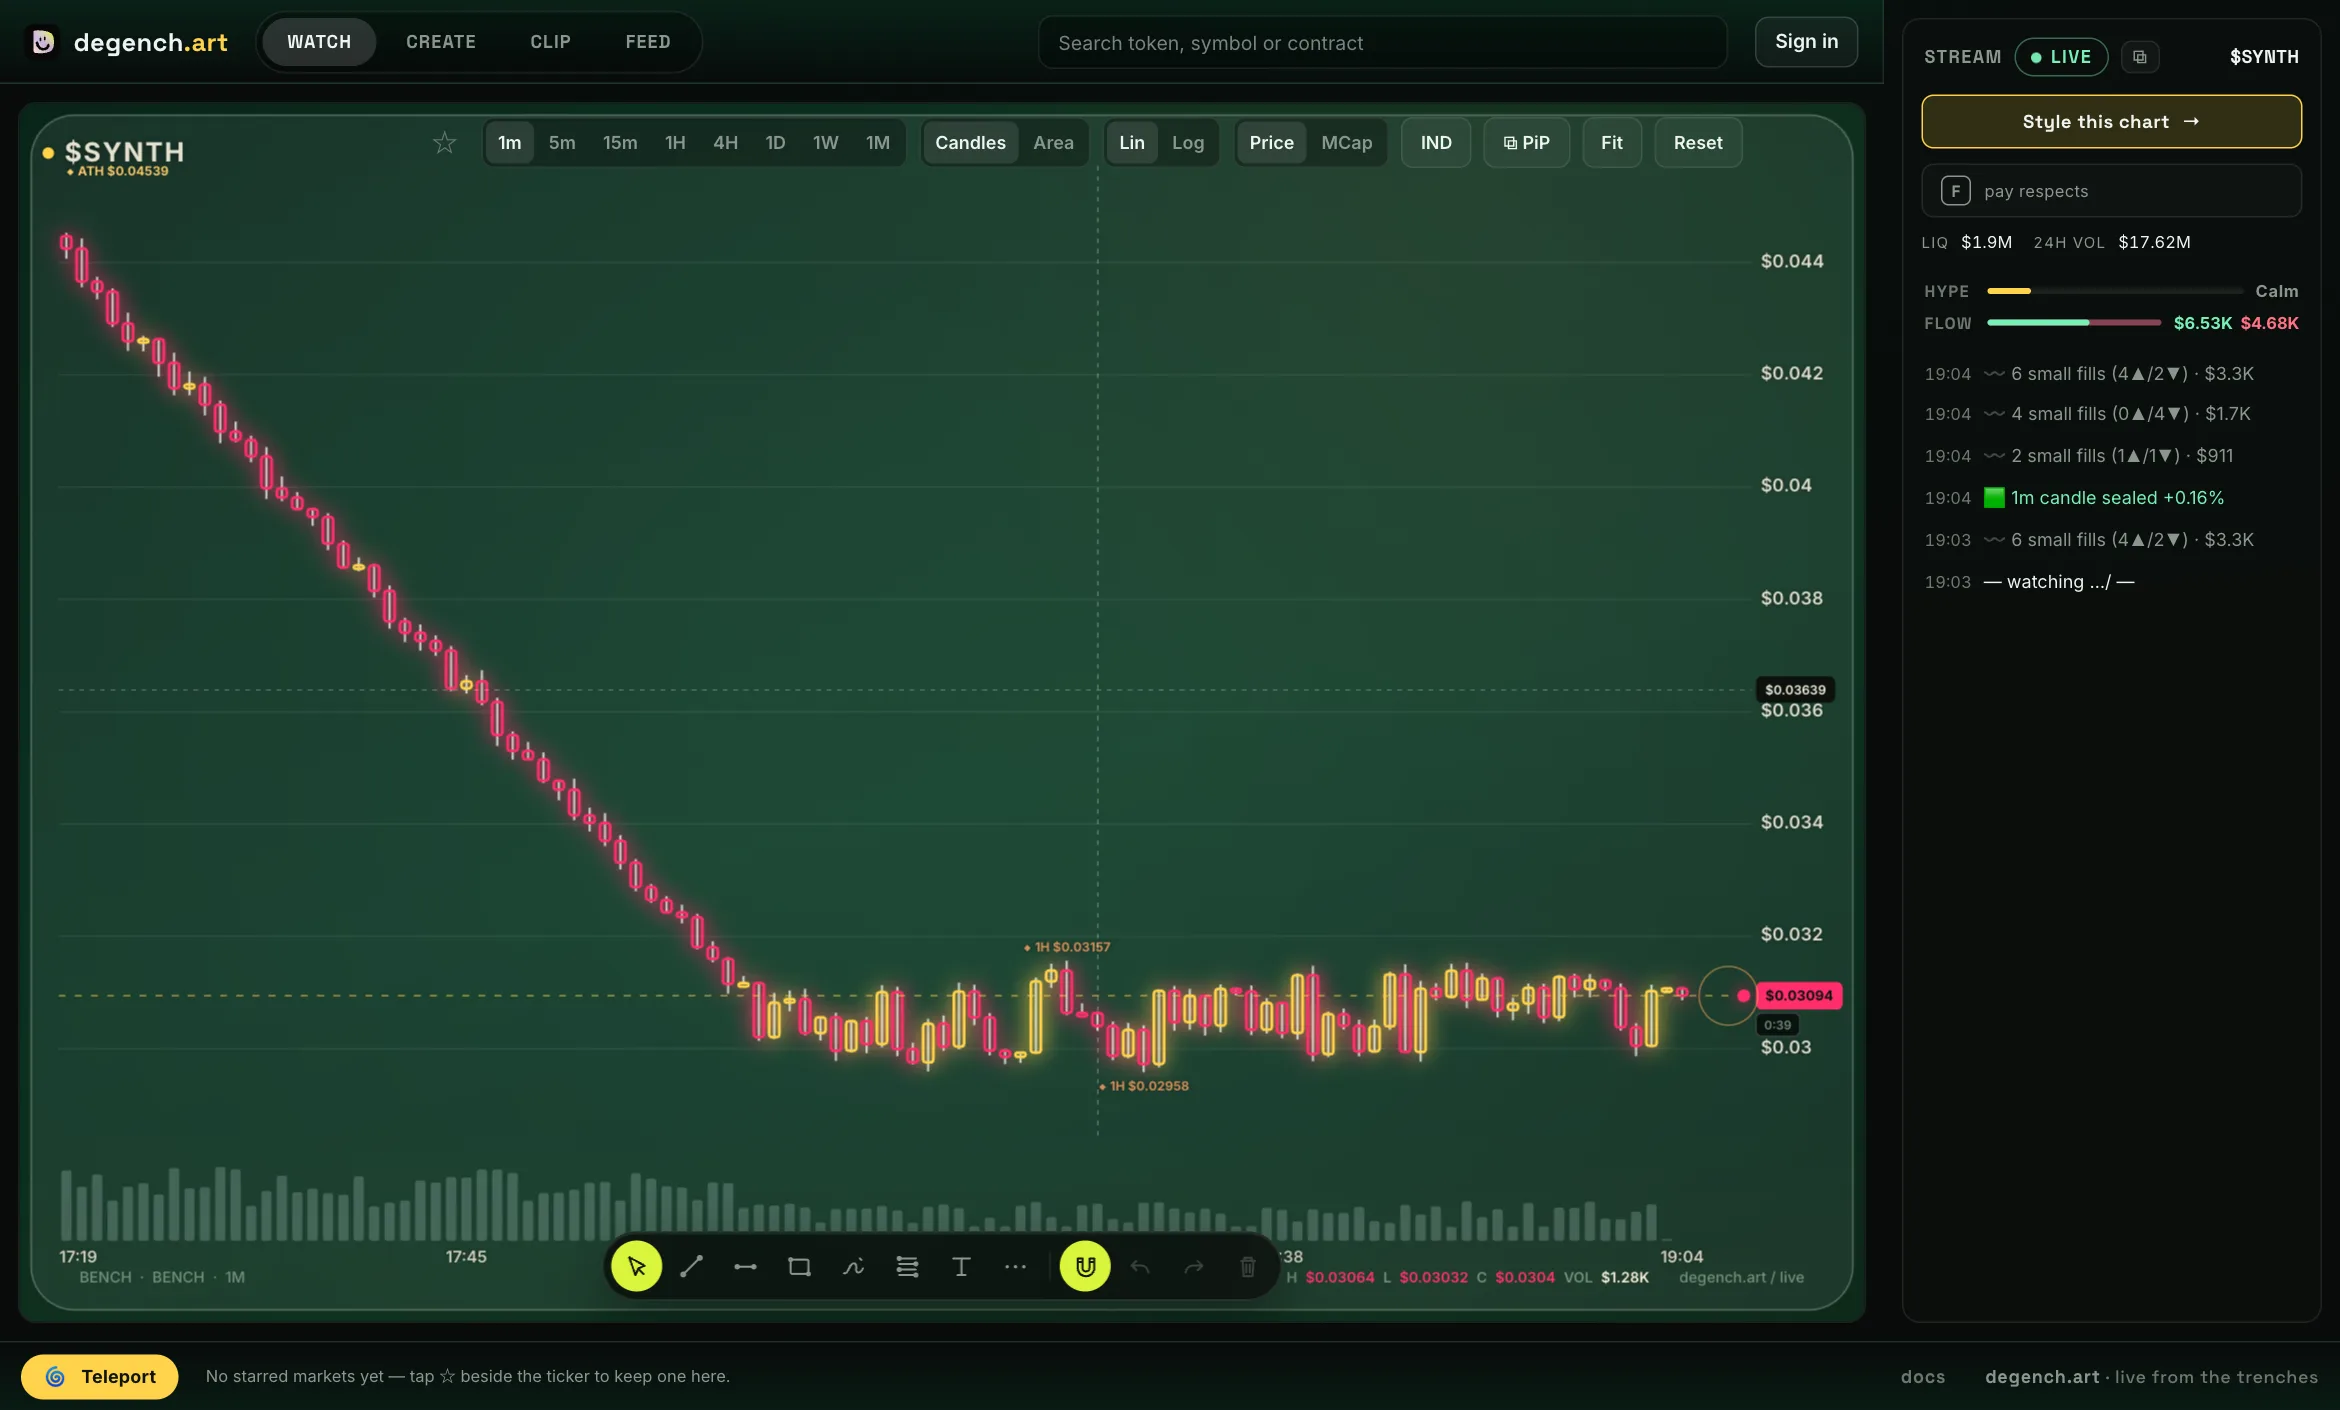
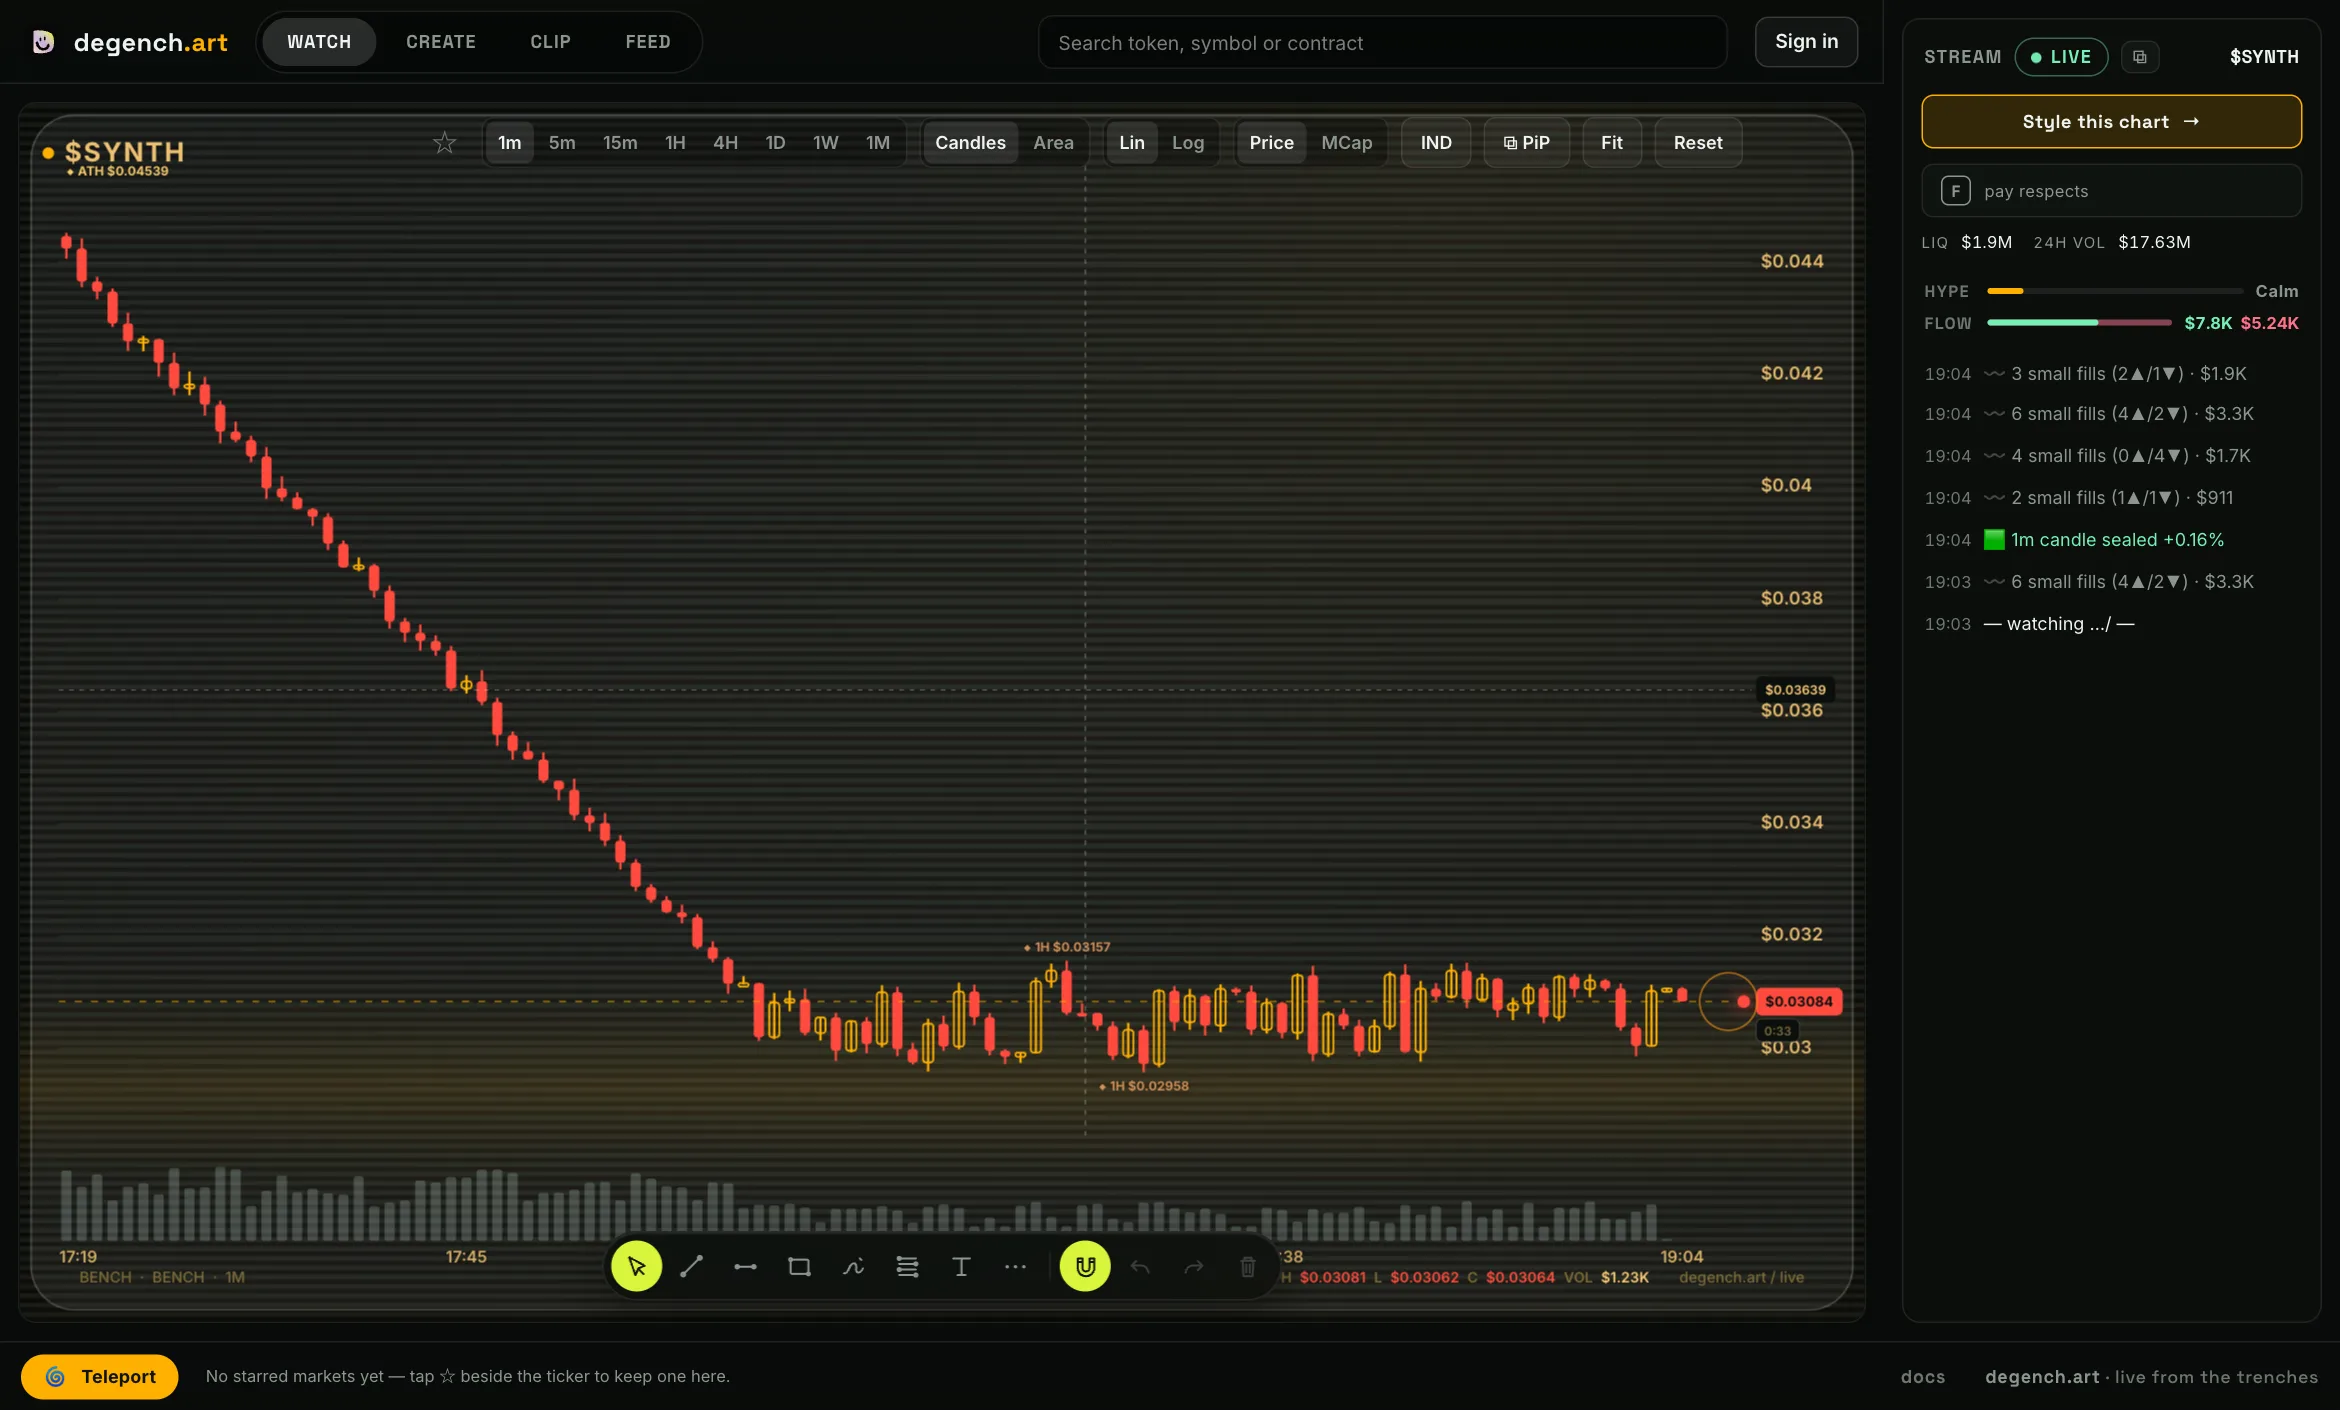
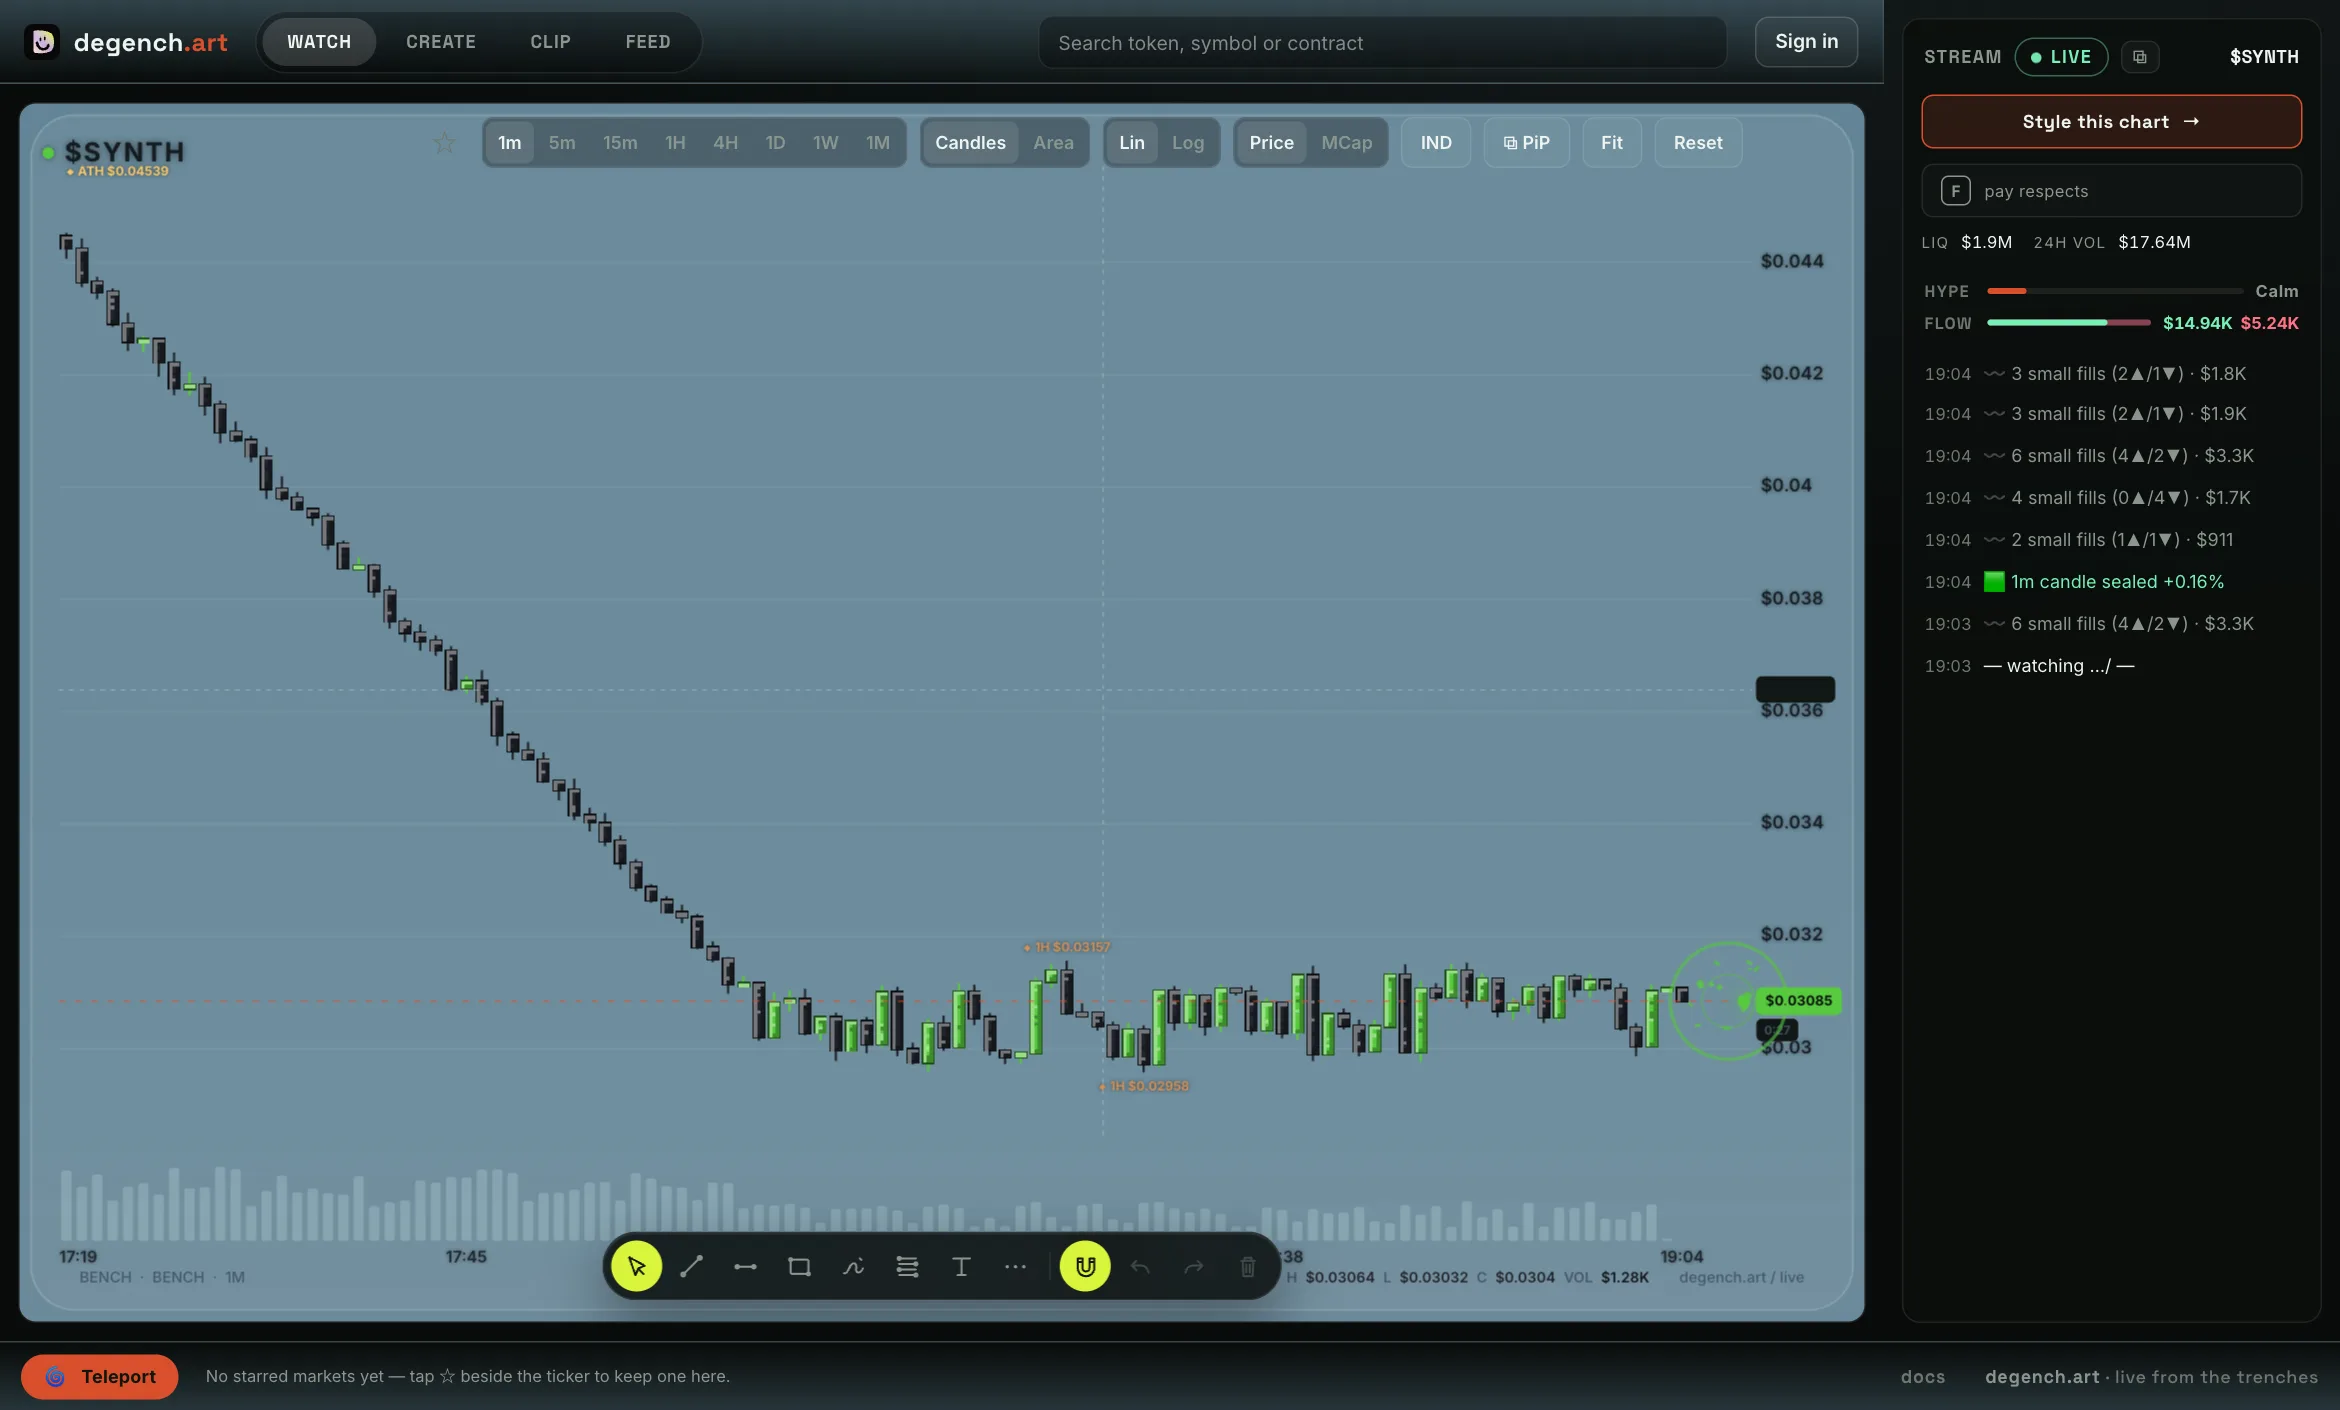
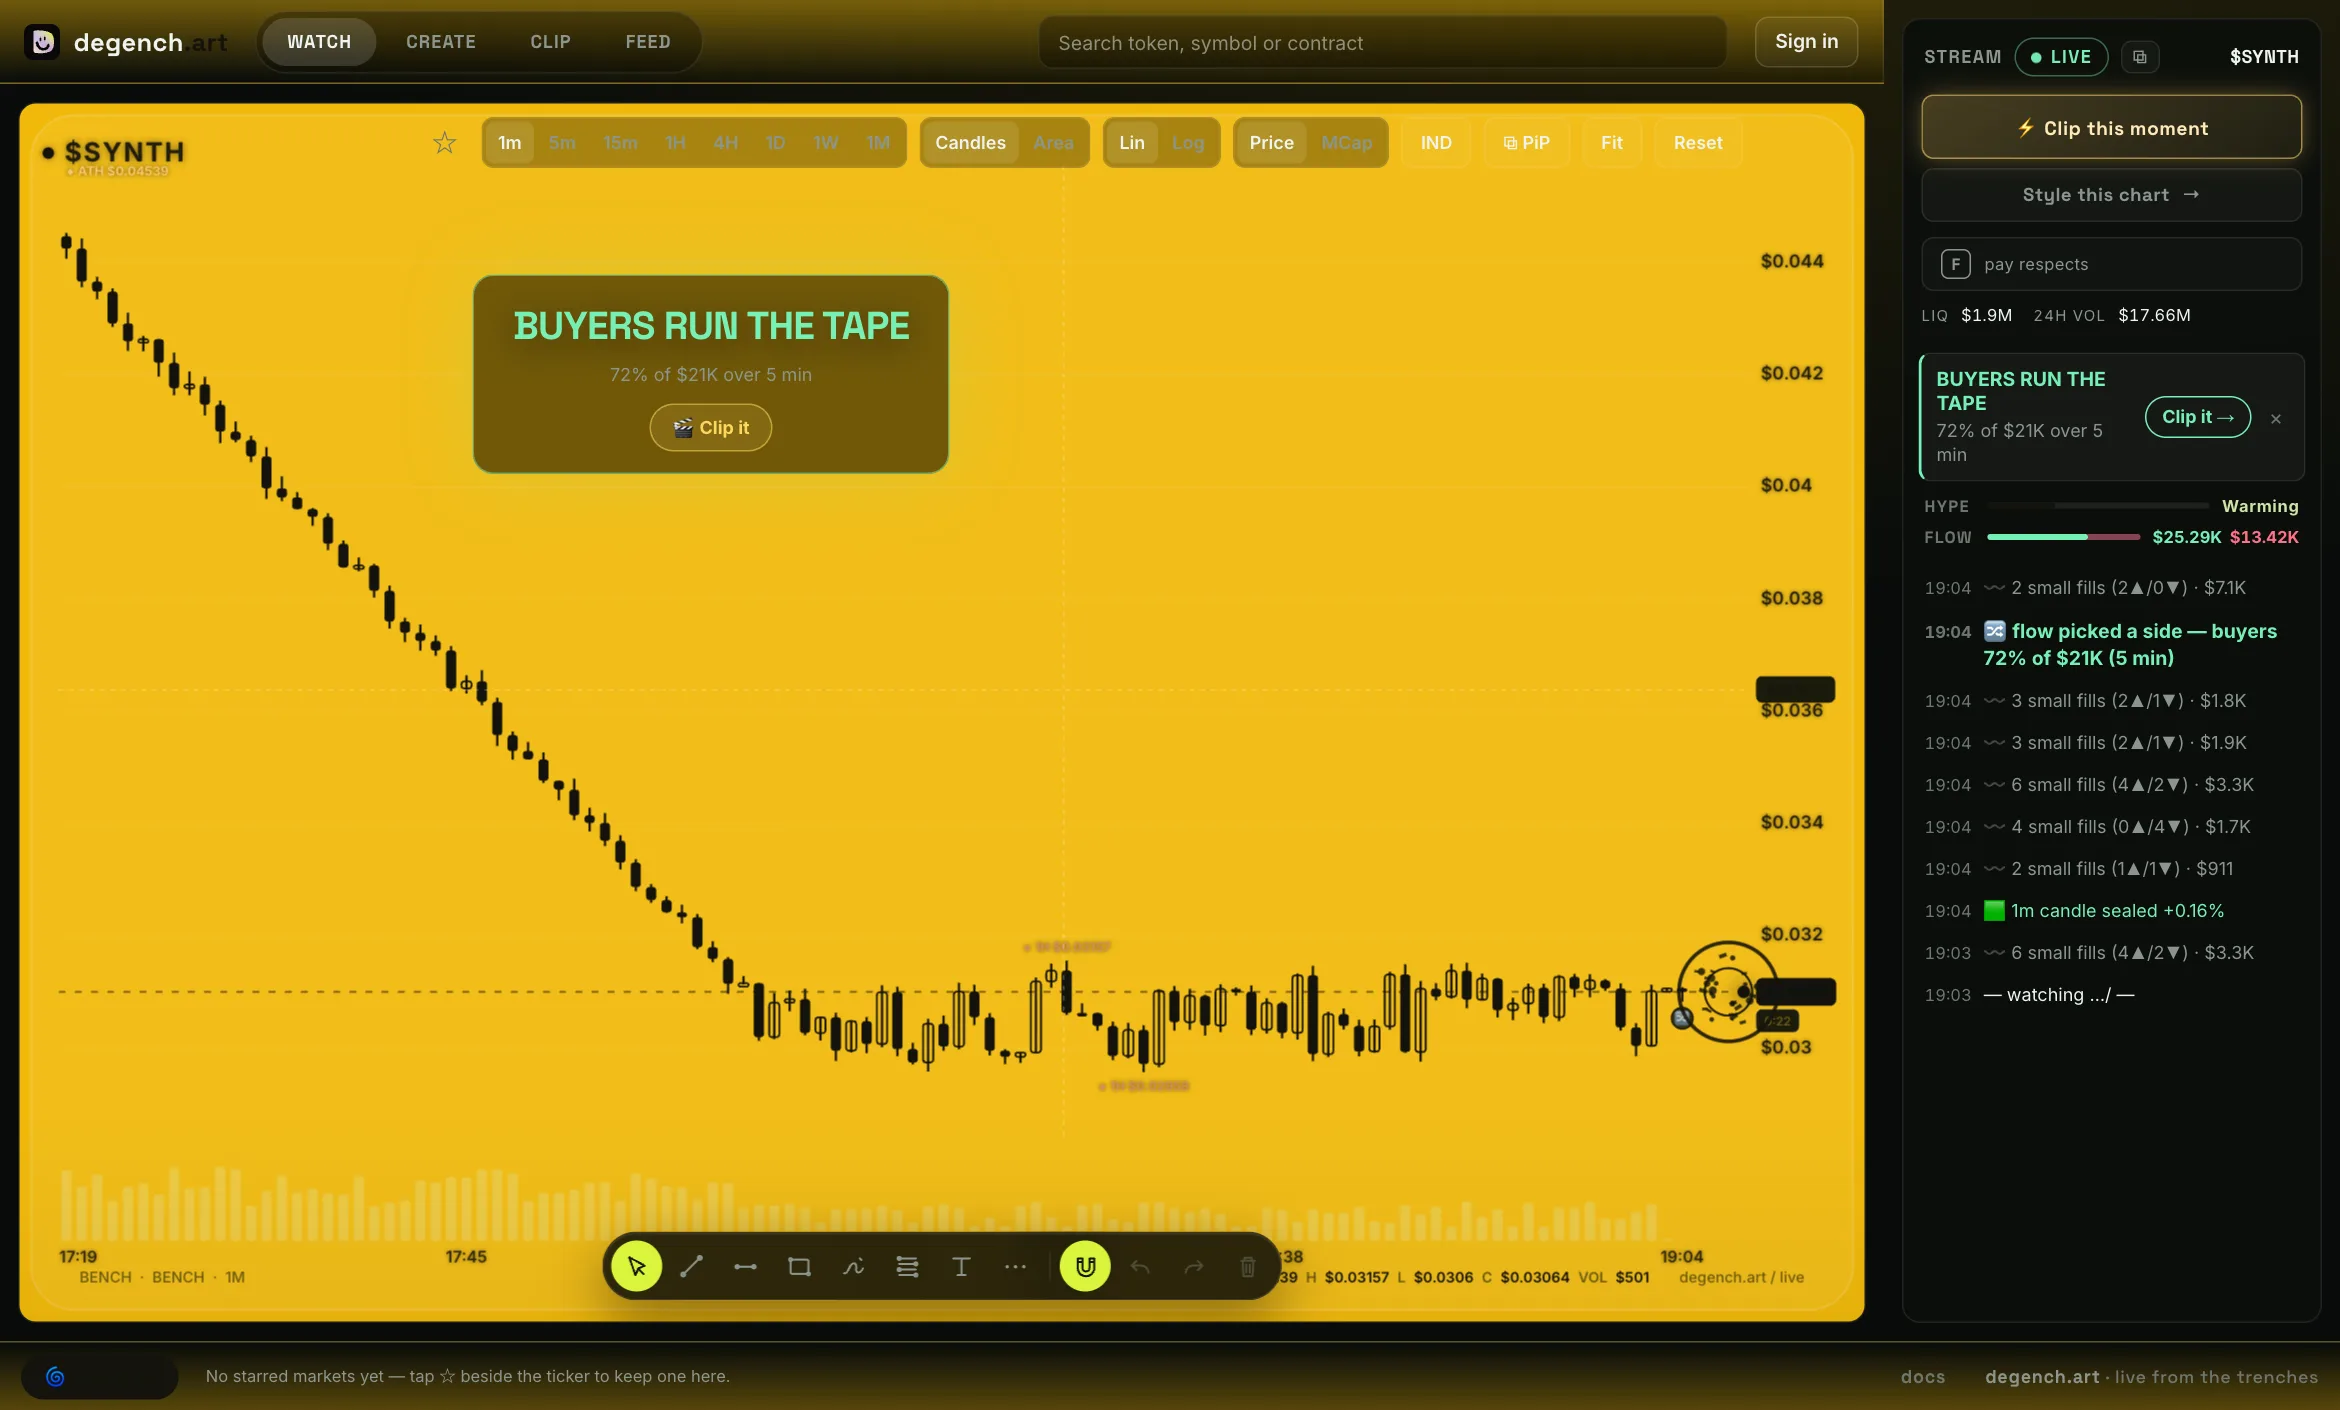
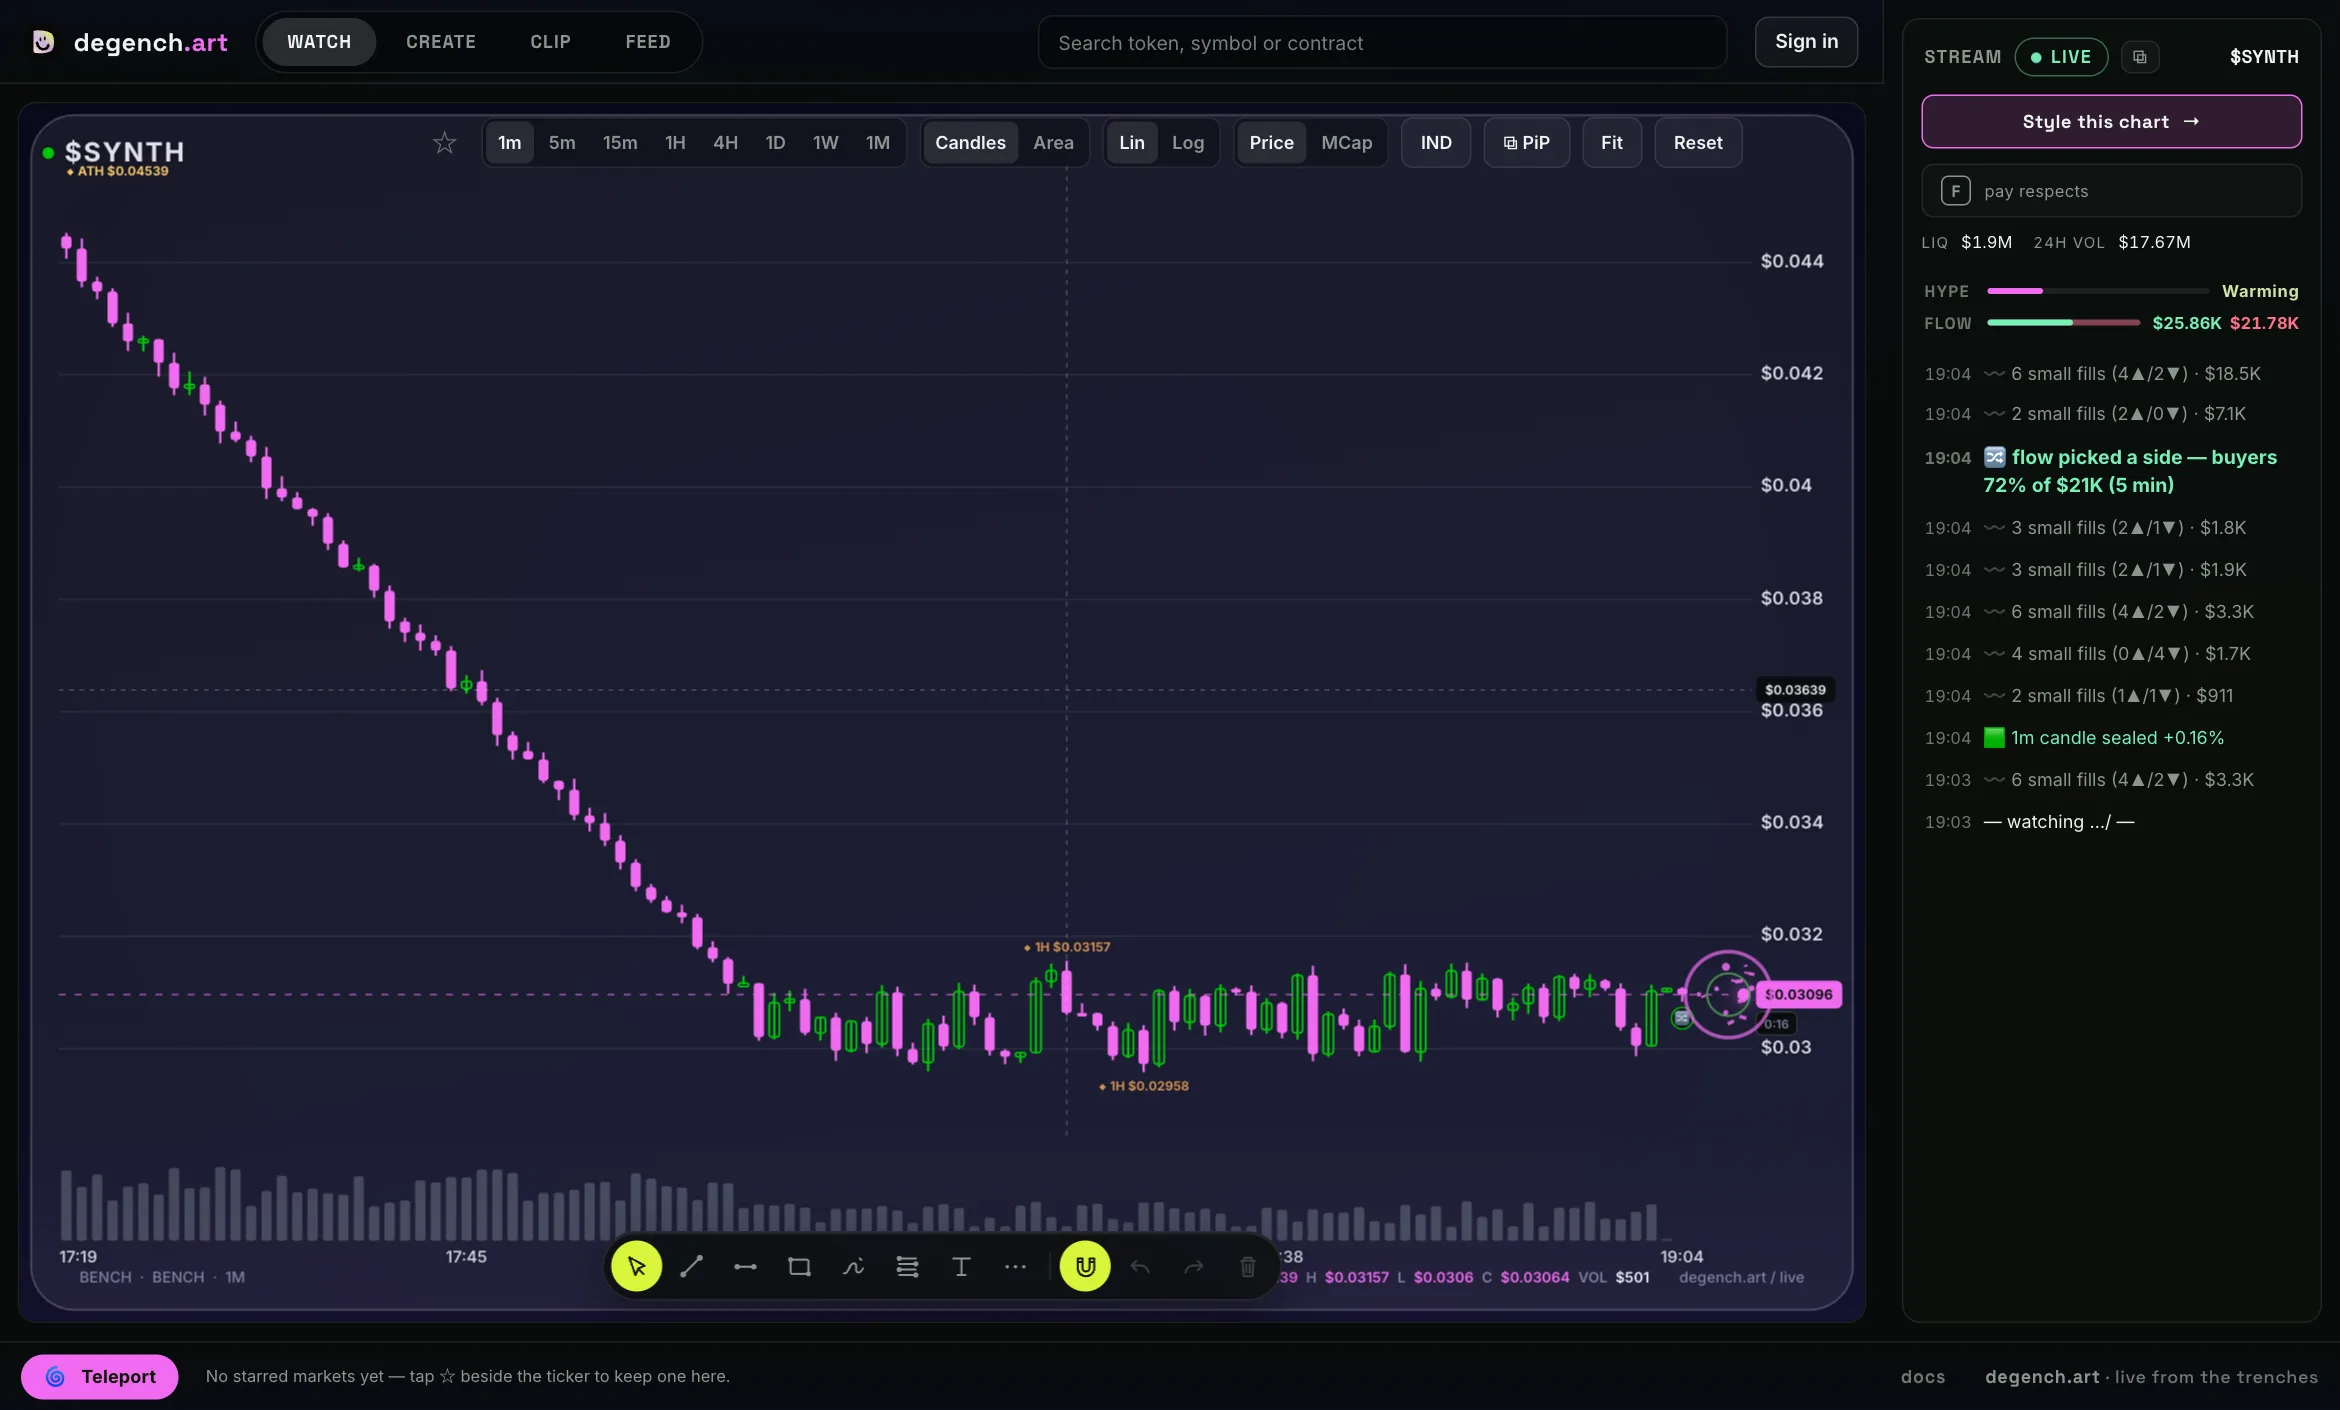
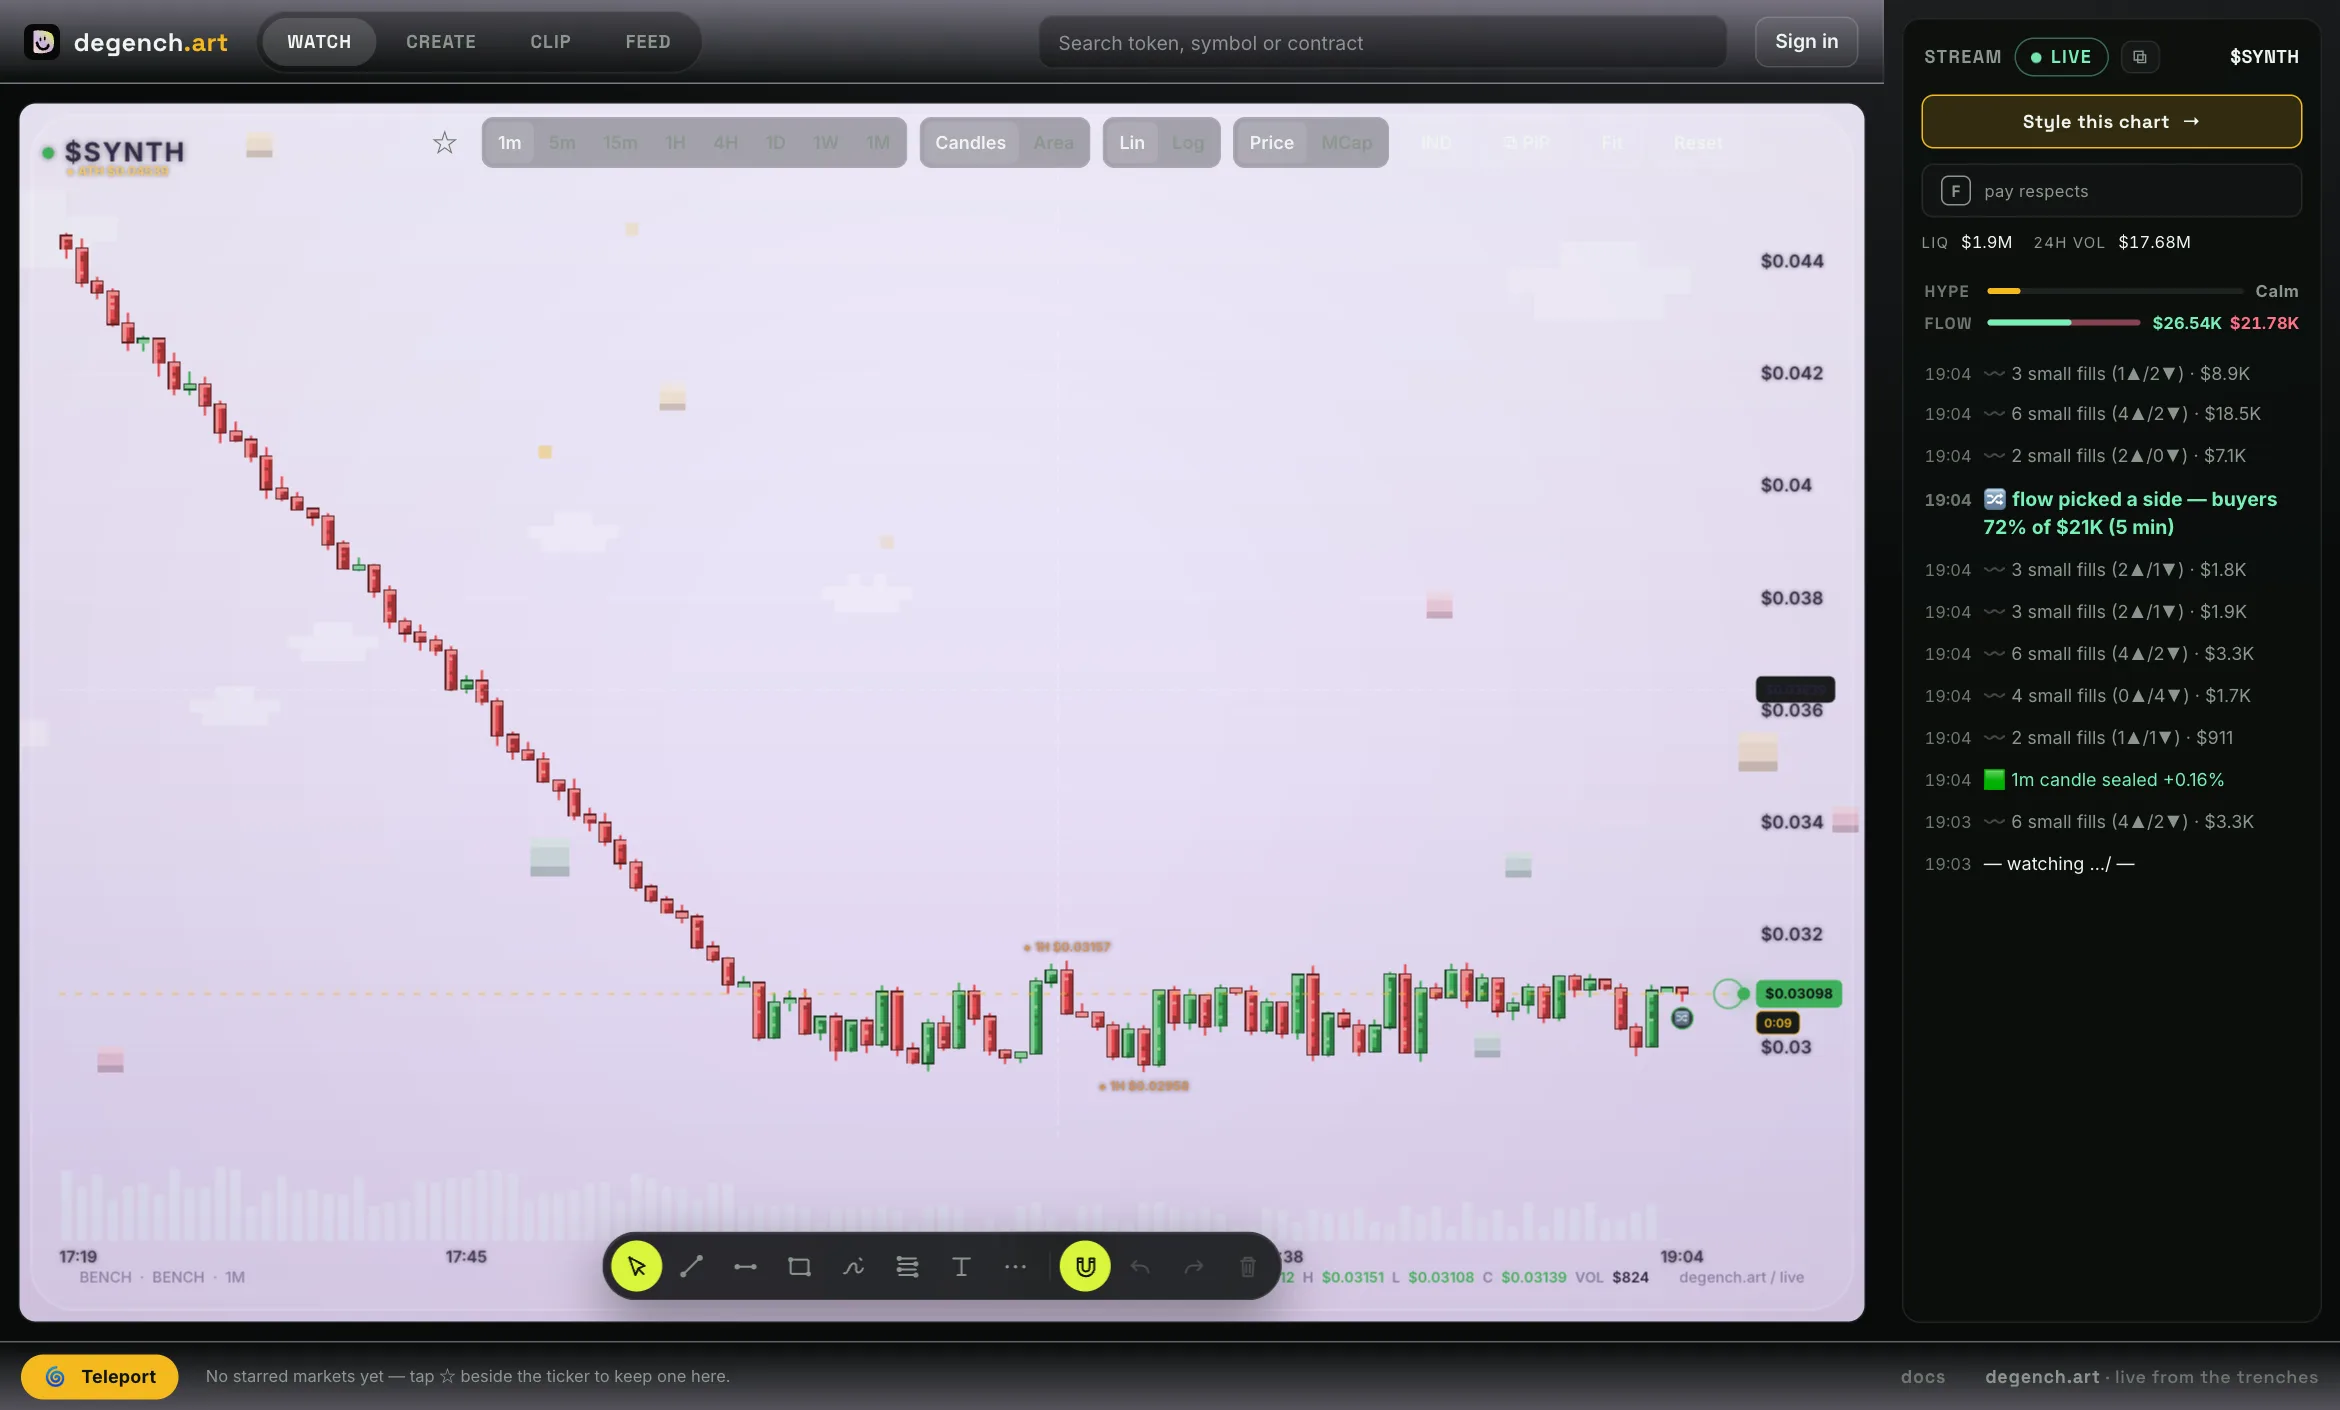
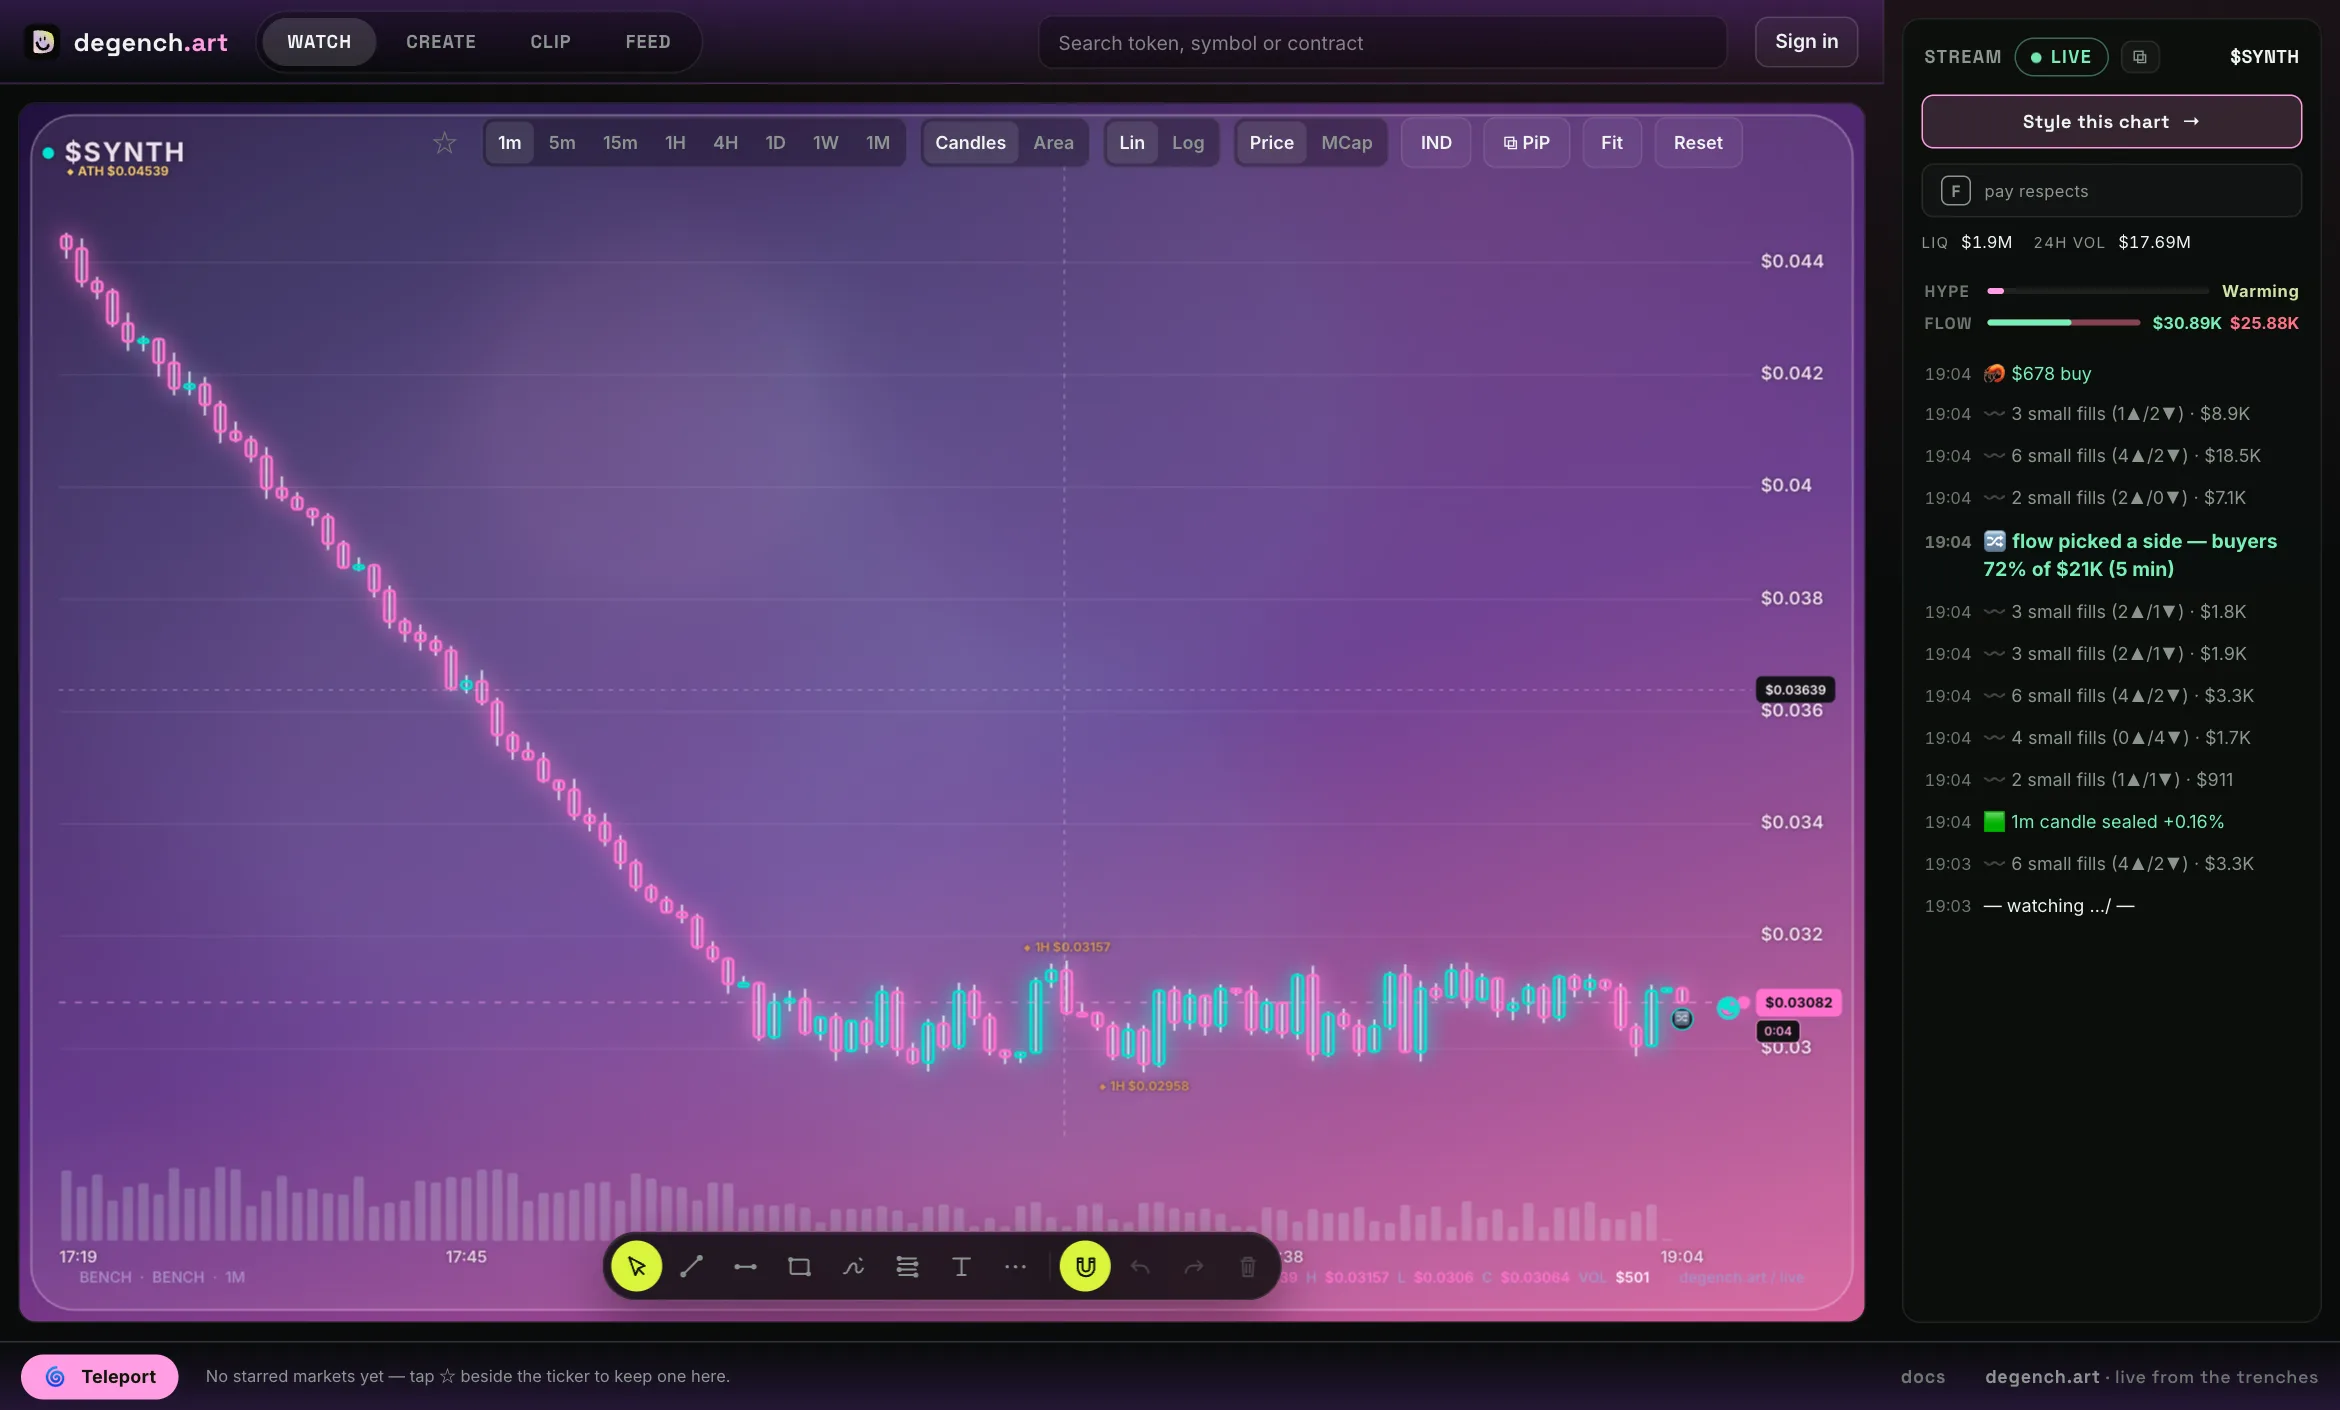 Degenchart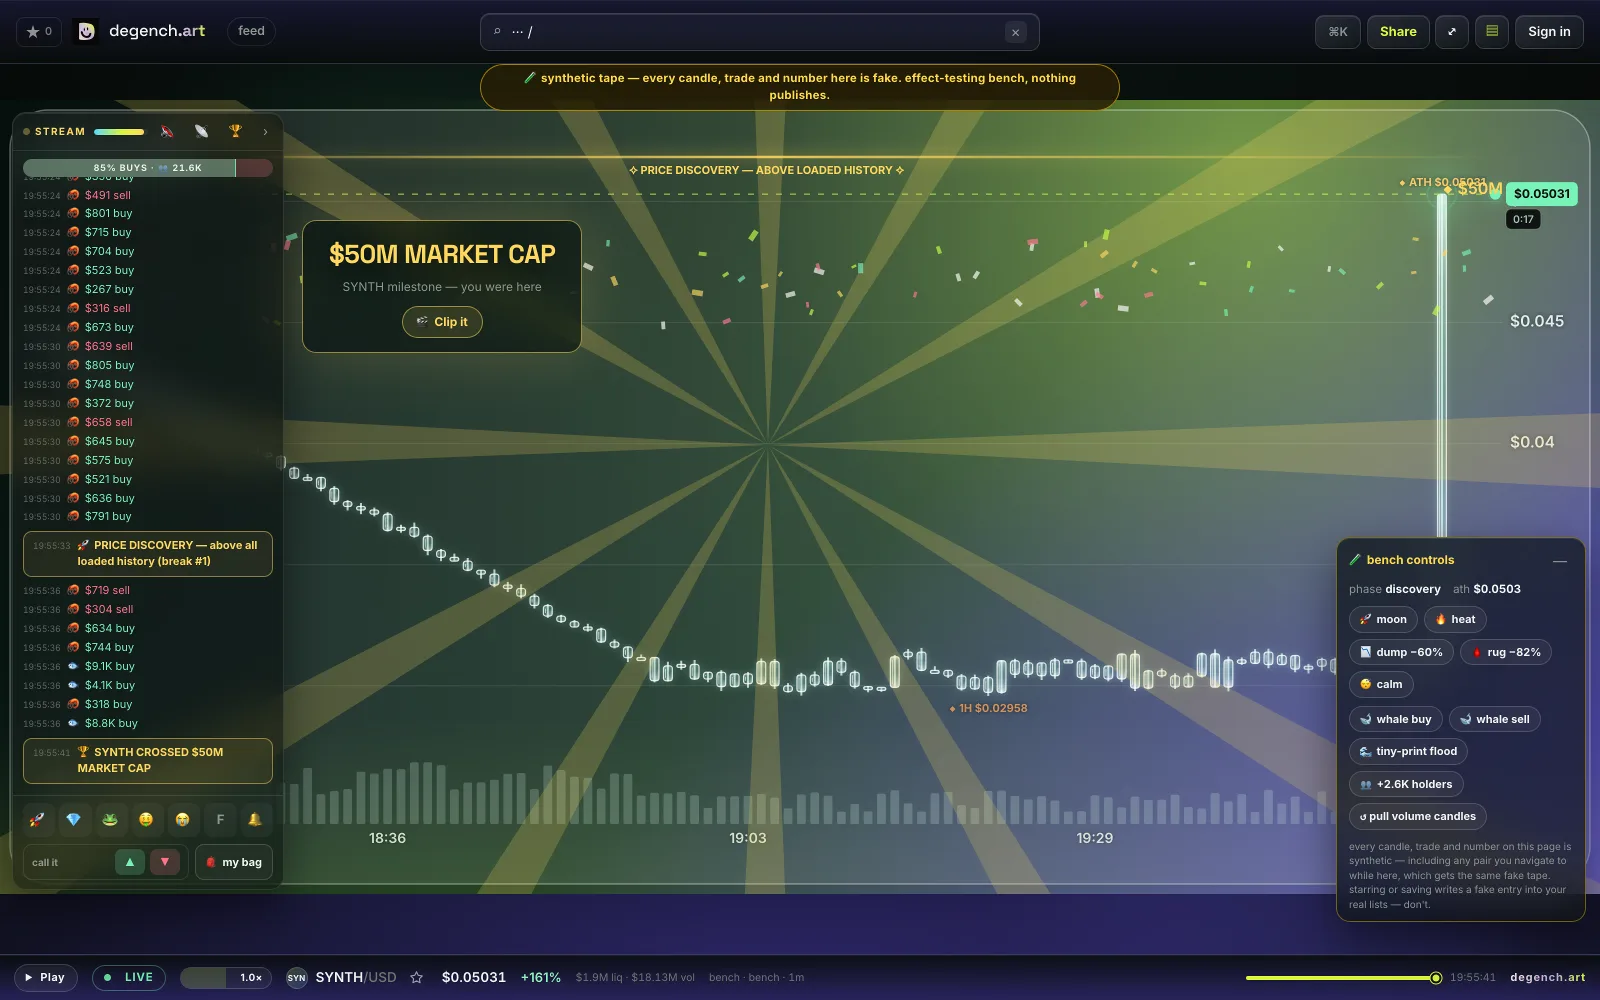
08data, accounts and risk
Know what the product can and cannot establish.
Pair discovery, current prices and token boosts come from DEX Screener. Pool candles, executed swaps, trending pools and token information come from GeckoTerminal or its CoinGecko on-chain mirror. Holder data can use public chain explorers as a fallback.
Responses are cached to stay within upstream limits. If a provider is slow or unavailable, the app may show an older successful response or report that the data is unavailable. Always verify the token address, pool, liquidity, slippage and transaction details in the wallet or execution venue before signing.
- Without an account
- Compositions, drawings, favourites, recents and source brand assets remain in that browser's local storage.
- With an account
- Supported setup data can sync between sessions. Wallet sign-in proves control of an address; degench.art does not receive the seed phrase or private key.
- When publishing
- The finished render is uploaded for the share card or feed post. If a local logo or background appears in that render, it is included in the finished media.
- No degench.art token
- There is no presale, allowlist or official token contract. Treat any token sold under the name as an impersonation unless this page is changed with a specific contract address.
degench.art is charting, monitoring and publishing software. Signals are descriptions of past and current data, not recommendations. The product does not guarantee profit, prevent loss, or establish that a posted call was traded.